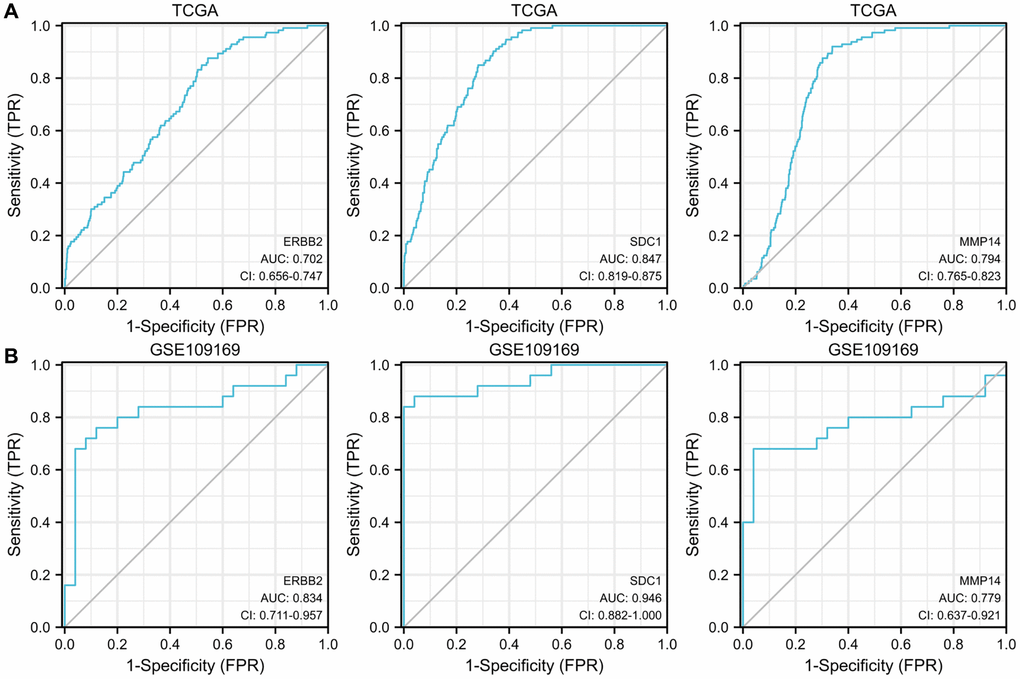
Figure 6.ROC curves show the diagnostic values of 3 upregulated ETGs (A) and are validated by the GSE109169 dataset (B).
Figure 6 — Clinical significance and immune characteristics analysis of miR-221-3p and its key target genes related to epithelial-mesenchymal transition in breast cancer | Aging