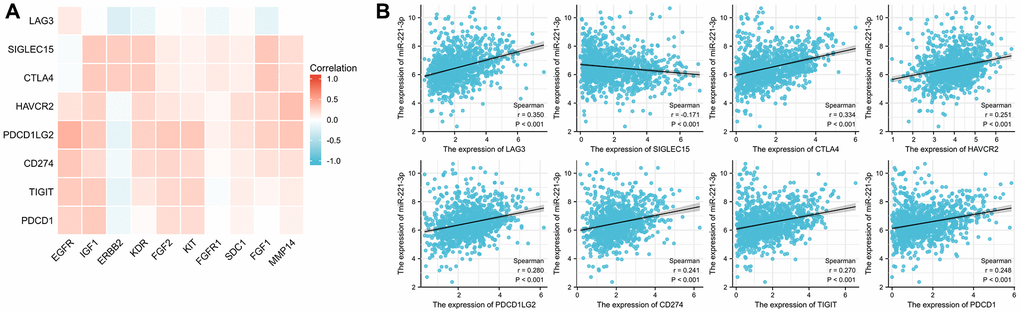
Figure 10.Correlation between ICGs and ETGs expression (A), and correlation between ICGs and miR-221-3p expression (B).
Figure 10 — Clinical significance and immune characteristics analysis of miR-221-3p and its key target genes related to epithelial-mesenchymal transition in breast cancer | Aging