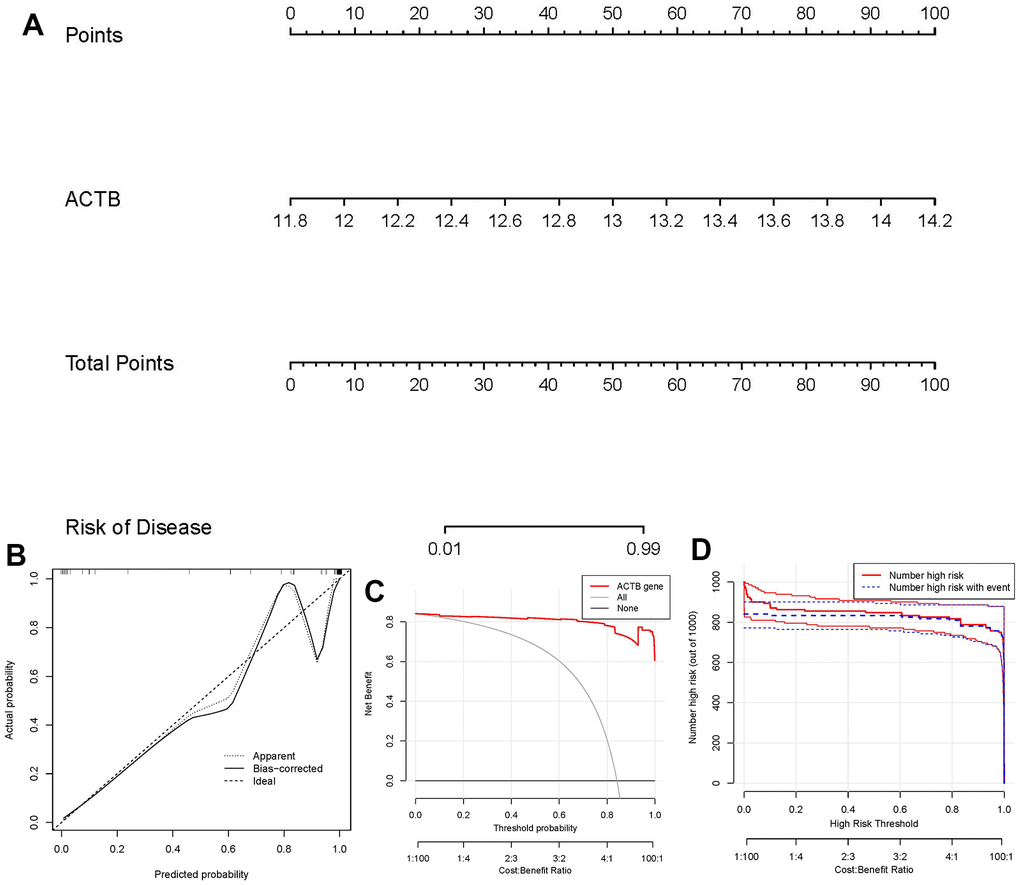
Figure 5.Establishment of the nomogram model. (A) The nomogram model was established on the basis of ACTB. (B) The calibration curve was utilized to evaluate the predictive accuracy of the nomogram model. (C) Decisions on the basis of this nomogram model may be beneficial to GC patients. (D) The clinical impact curve was used to assess clinical impact of the nomogram model.