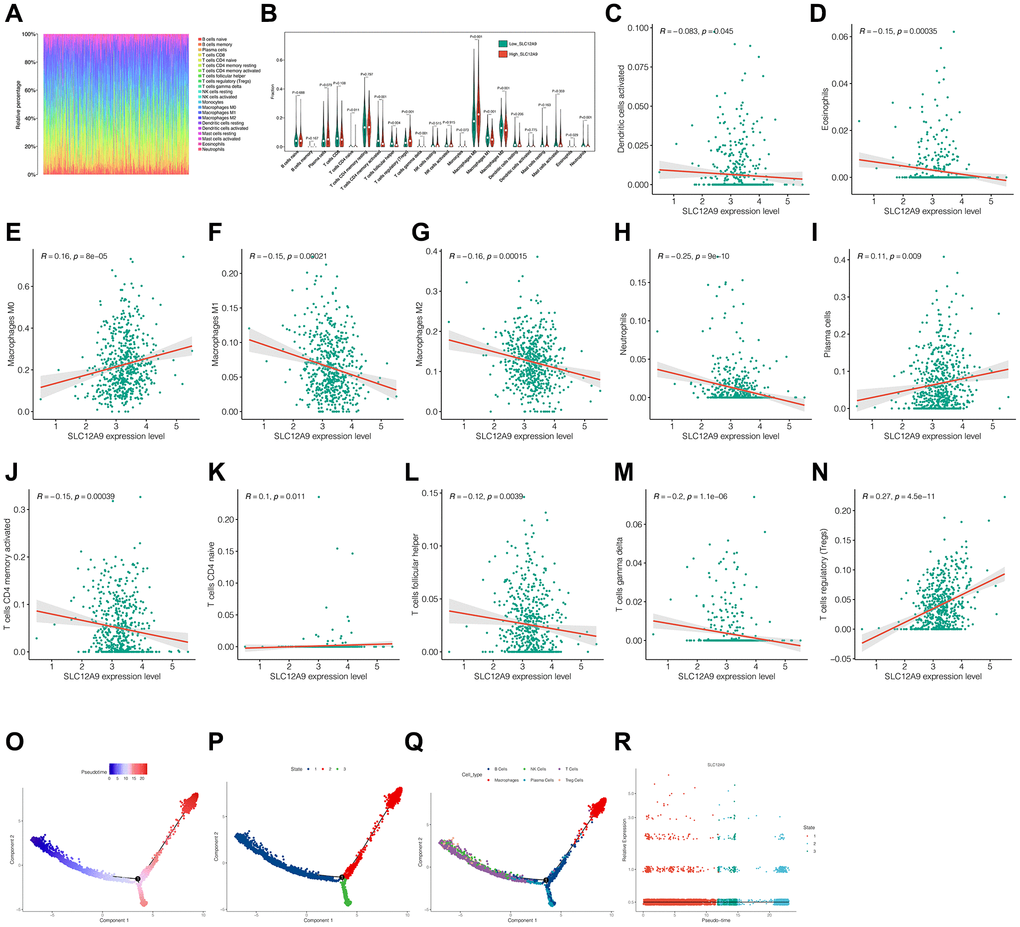
Figure 6.Correlation analysis of immune cell infiltration. (A) Immune landscape of colorectal cancer sample from the TCGA dataset. (B) Infiltration of different immune cells between high and low SLC12A9. (C–N) Correlation analysis between SLC12A9 and immune cells. (O–R) Pseudo-time series analysis of immune cells and SLC12A9.