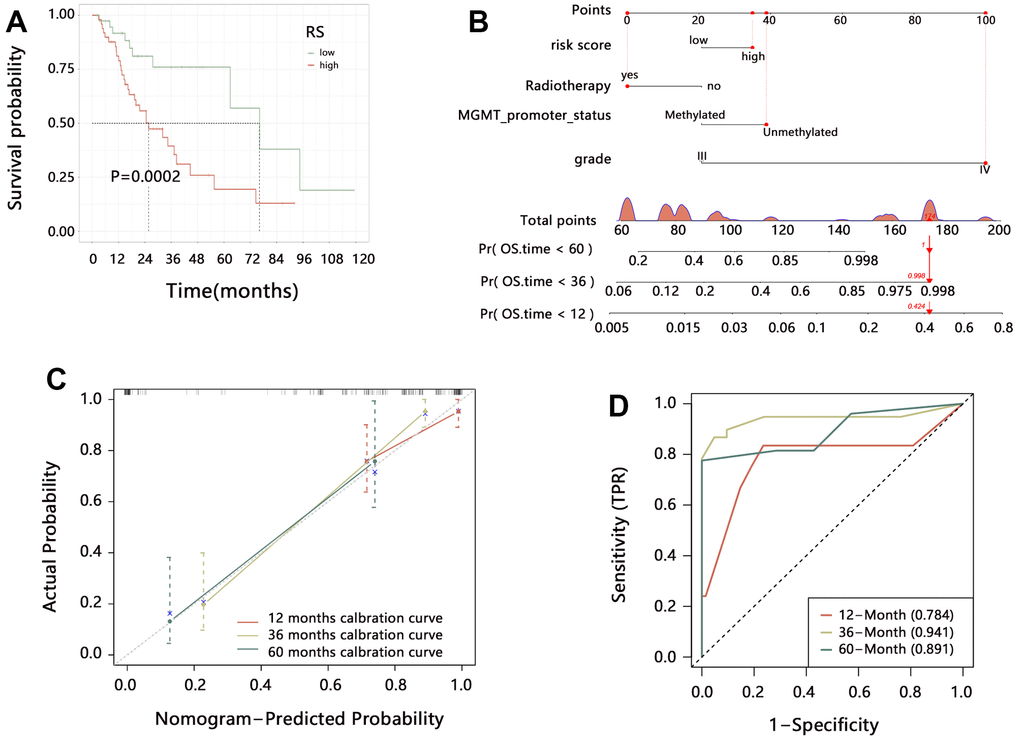
Figure 9.The clinical value of the radiomics model in HGG. (A) Kaplan-Meier analysis on radiomics score. (B) Establishment of comprehensive nomogram model. (C) Evaluation of nomogram model with calibration curves. (D) Performance assessment of nomogram model with time-dependent ROC analysis.