Submit an Article
Navigate
Home
Editorial Board
Editorial Policies
Current Volume
Archive
Scientific Integrity
Publication Ethics Statements
Interviews with Outstanding Authors
Newsroom
Sponsored Conferences
Podcast
Contact
Special Collections
Submit an Article
Online ISSN: 1945-4589
Research Paper
|
Volume 15, Issue 24
|
pp. 15402–15418
Integrated analysis reveals the potential of cluster of differentiation 86 as a key biomarker in high-grade glioma
Back to article
Figure 5
(5 of 9)
−
100%
+
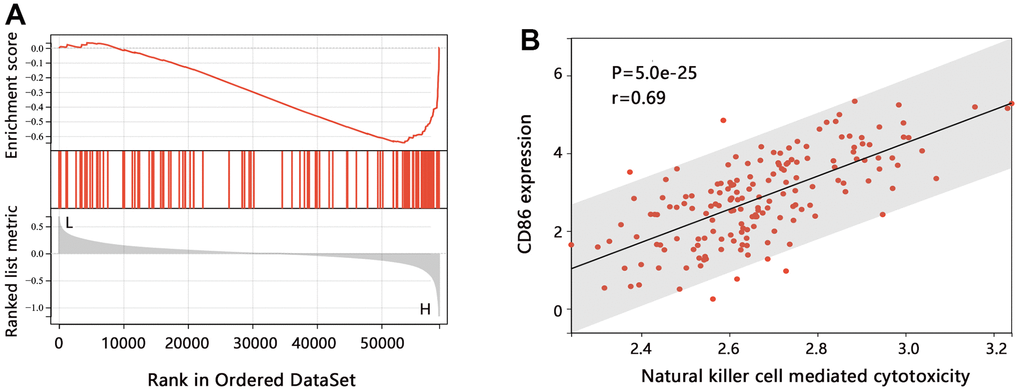
Figure 5.
The pathway enrichment analysis in HGG.
(
A
) GSEA analysis on CD86. (
B
) Relation between the ssGSEA score of each sample and CD86 expression level.