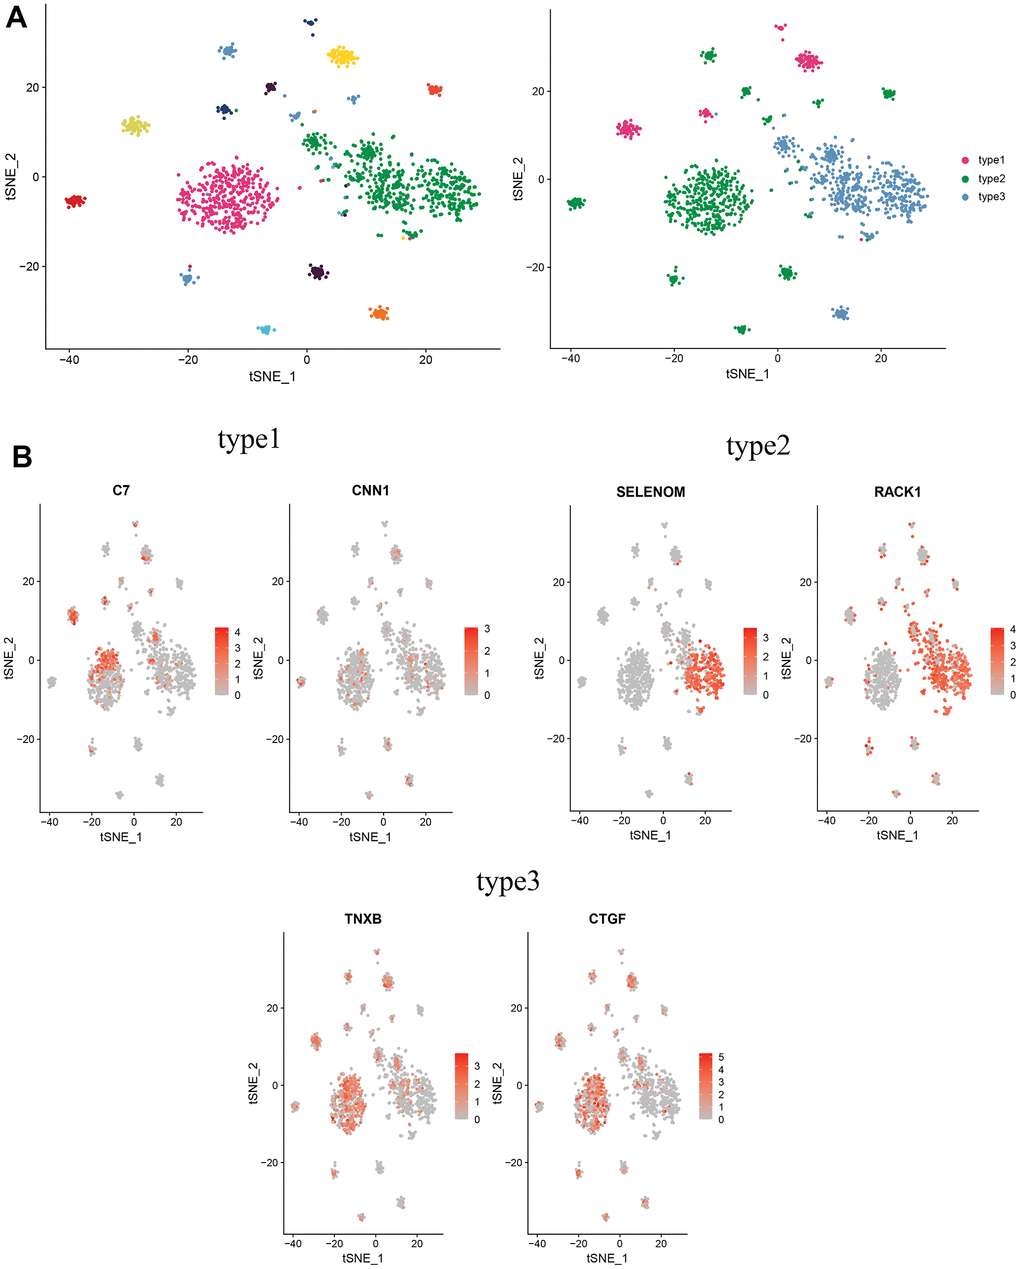
Figure 8.Distinguishing new subtypes of CAFs. (A) tSNE plot of CAFs with reduced dimensional clustering; (B) tSNE plot of maker genes for 3 cell subpopulations.
Figure 8 — Analysis of cancer-associated fibroblasts in cervical cancer by single-cell RNA sequencing | Aging