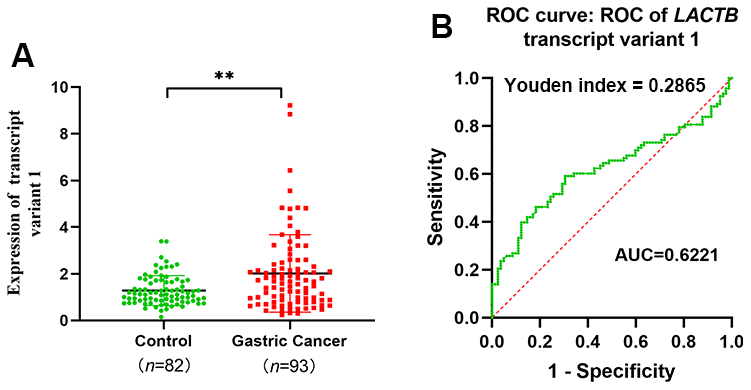
Figure 2.LACTB transcript variant 1 expression and diagnosis in peripheral venous blood of gastric cancer patients. (A) Expression level of LACTB transcript 1 in venous peripheral blood of gastric cancer patients. (B) ROC curve of LACTB transcript variant 1. **P<0.01 vs. Control.