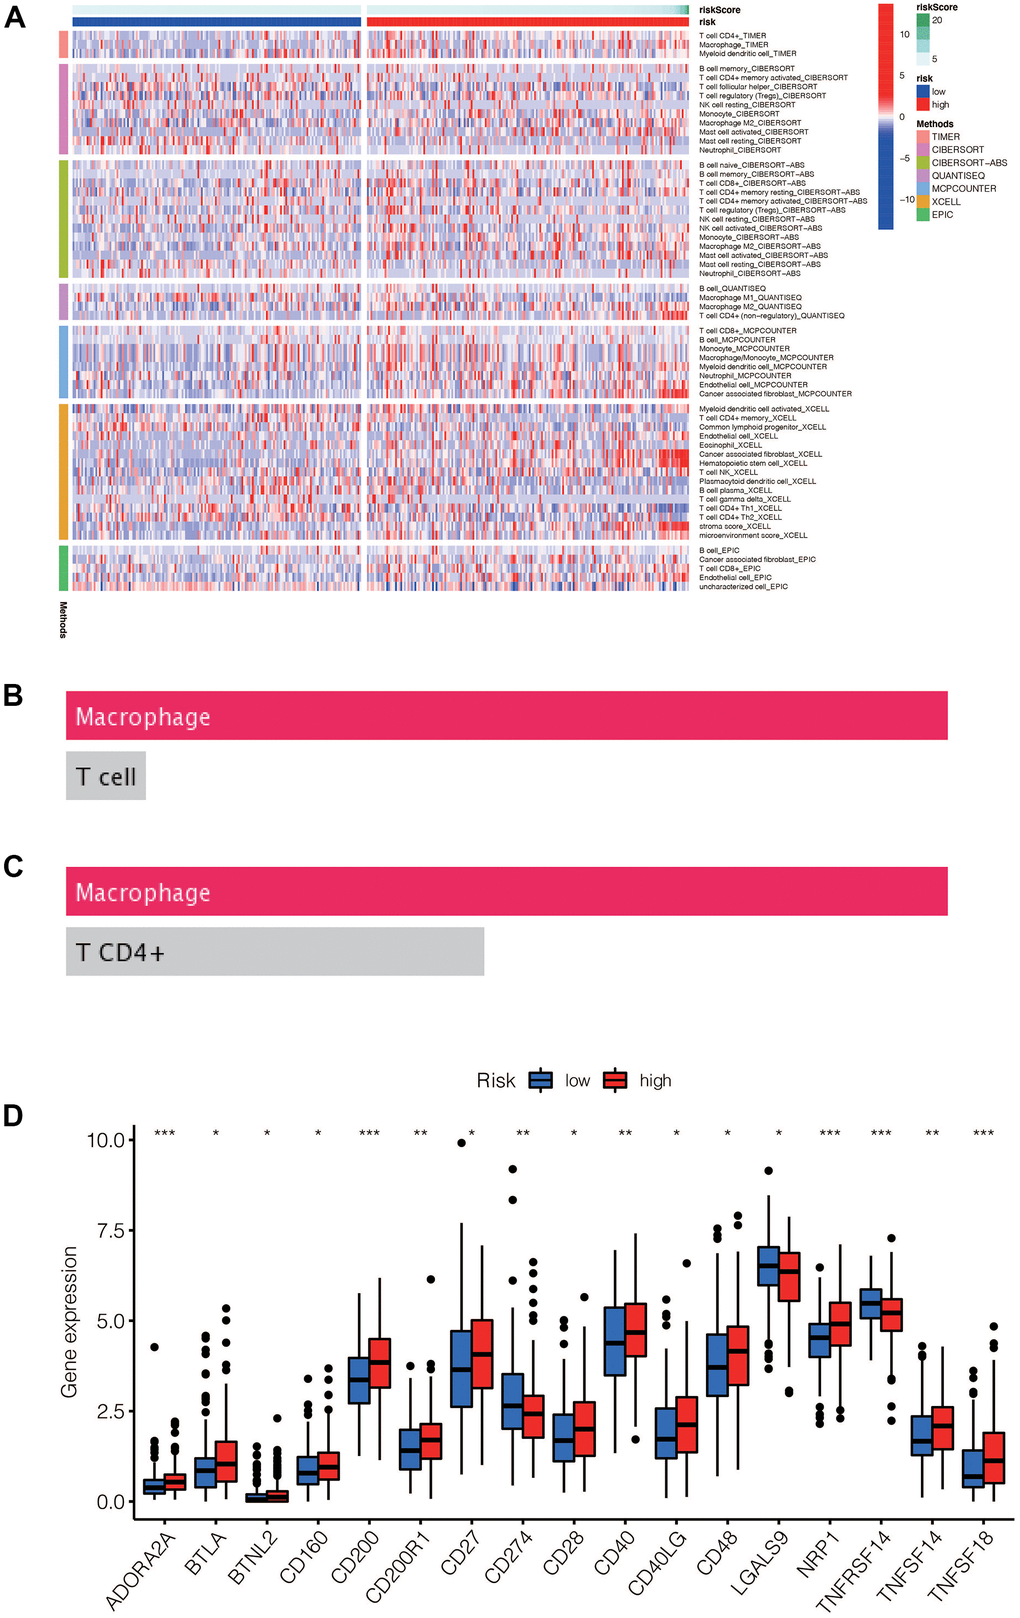
Figure 9.(A) Heat maps of immune cells that differ between the high-risk and low-risk groups. (B, C) Macrophage was the most different immune cells predicted by Dreimt database among the high-risk and low-risk groups (p<0.05). (D) Immune checkpoint genes that were differentially expressed in the high-risk and low-risk groups were selected and presented in a boxplot. (* p< 0.05, **p < 0.01, * * * p< 0.001).