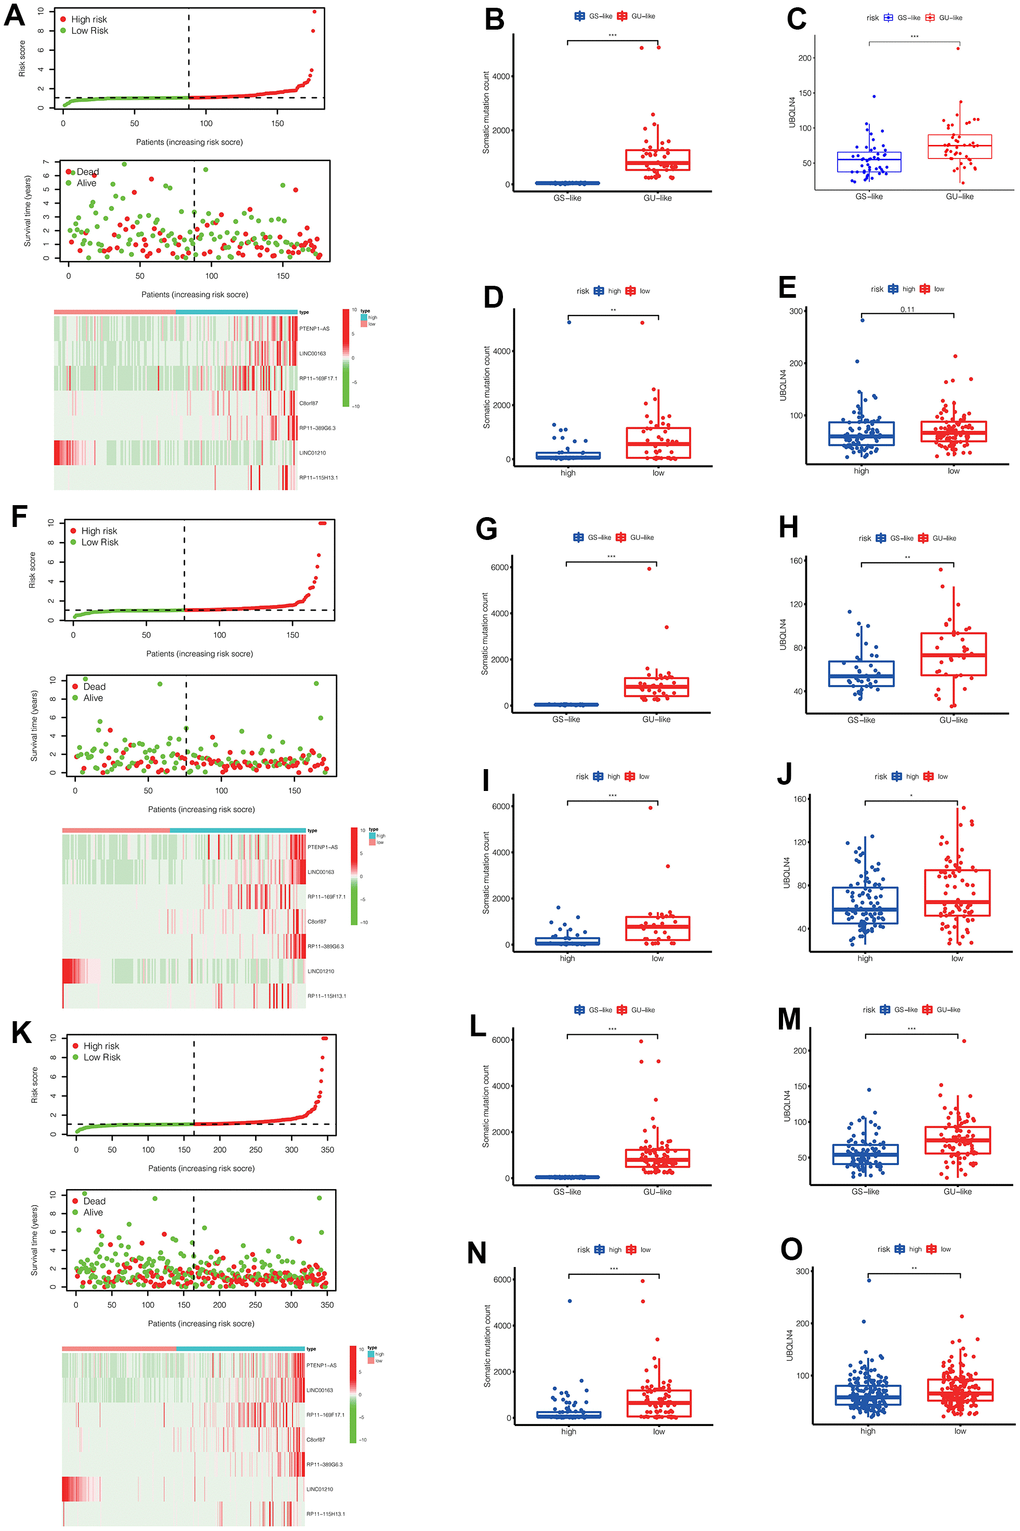
Figure 5.(A) In the training set, we can see the distribution of patient survival and death as the risk score increased, as well as the heat map of lncRNAs expression in the high-risk and low-risk groups. (B, C) In the training set, the number of somatic mutations and the expression of UBQLN4 gene were different between the GS-like group and the Gu-like group (** p<0.01, *** p<0.001). (D, E) In the training set, the number of somatic mutations and the expression of UBQLN4 gene were different between the high-risk group and the low-risk group (** p<0.01, *** p<0.001). (F) In the validation set, we can see the distribution of patient survival and death as the risk score increased, as well as the heat map of lncRNAs expression in the high-risk and low-risk groups. (G, H) In the validation set, the number of somatic mutations and the expression of UBQLN4 gene were different between the GS-like group and the Gu-like group (** p <0.01, *** p<0.001). (I, J) In the validation set, the number of somatic mutations and the expression of UBQLN4 gene were different between the high-risk group and the low-risk group (** p <0.01, *** p <0.001). (K) In the entire set, we can see the distribution of patient survival and death as the risk score increased, as well as the heat map of lncRNAs expression in the high-risk and low-risk groups. (L, M) In the entire set, the number of somatic mutations and the expression of UBQLN4 gene were different between the GS-like group and the Gu-like group (** p<0.01, *** p <0.001). (N, O) In the entire set, the number of somatic mutations and the expression of UBQLN4 gene were different between the high-risk group and the low-risk group (** p <0.01, ***p <0.001).