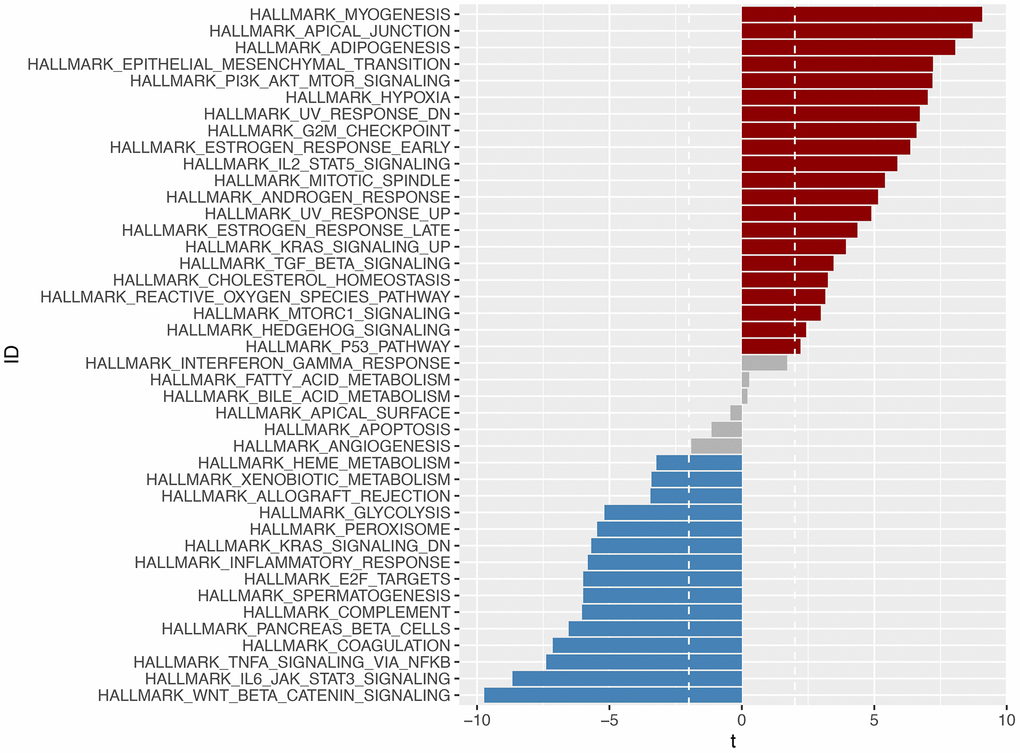
Figure 11.Through GSVA analysis, significant enrichment pathways with differences in the high-risk and low-risk groups were obtained (p <0.05). Pathways enriched in the high-risk group were marked in red, those enriched in the low-risk group were marked in blue, and those enriched in -2