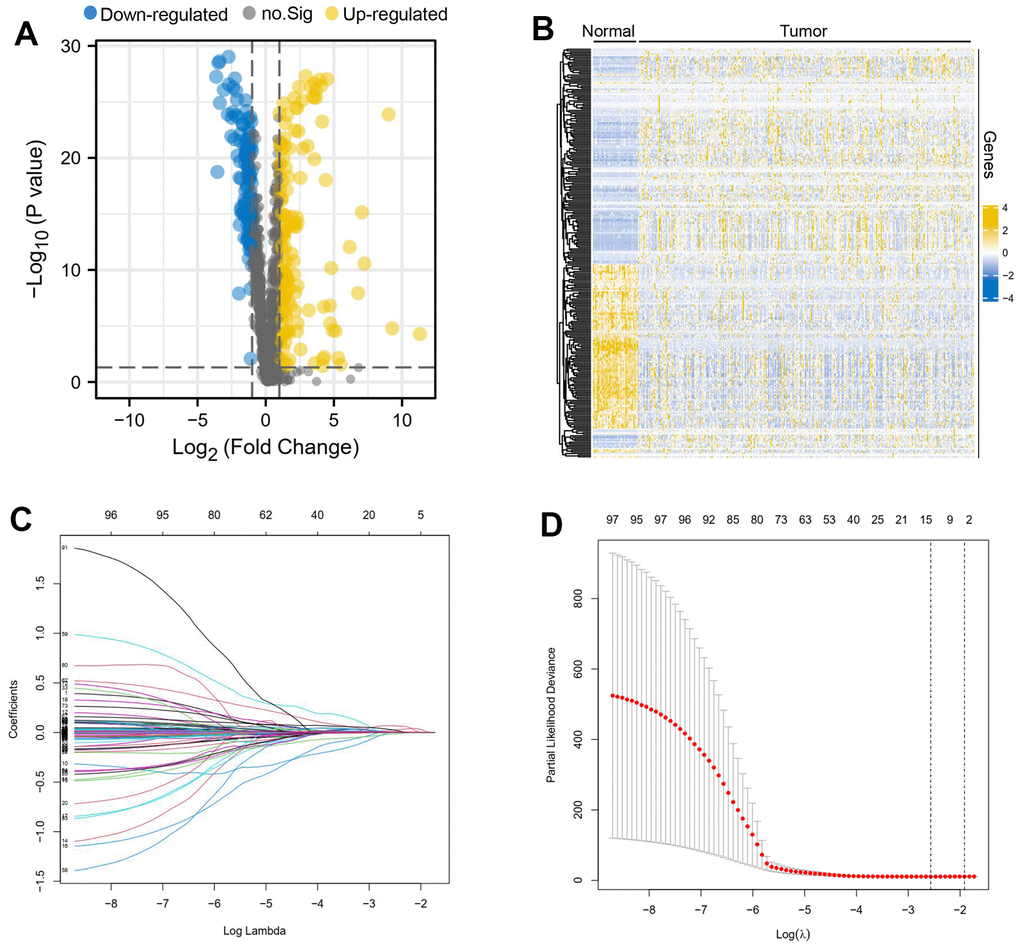
Figure 1.Differential oxidative stress-related genes between liver cancer and normal tissues. A volcano map (A) and heatmap (B) about differential oxidative stress-related genes was created, the down-regulated genes were expressed in blue, the up-regulated genes in yellow and the genes that did not differ between groups were represented in grey. Lambda obtained minimum value (C), model enrolled 11 important genes (D).