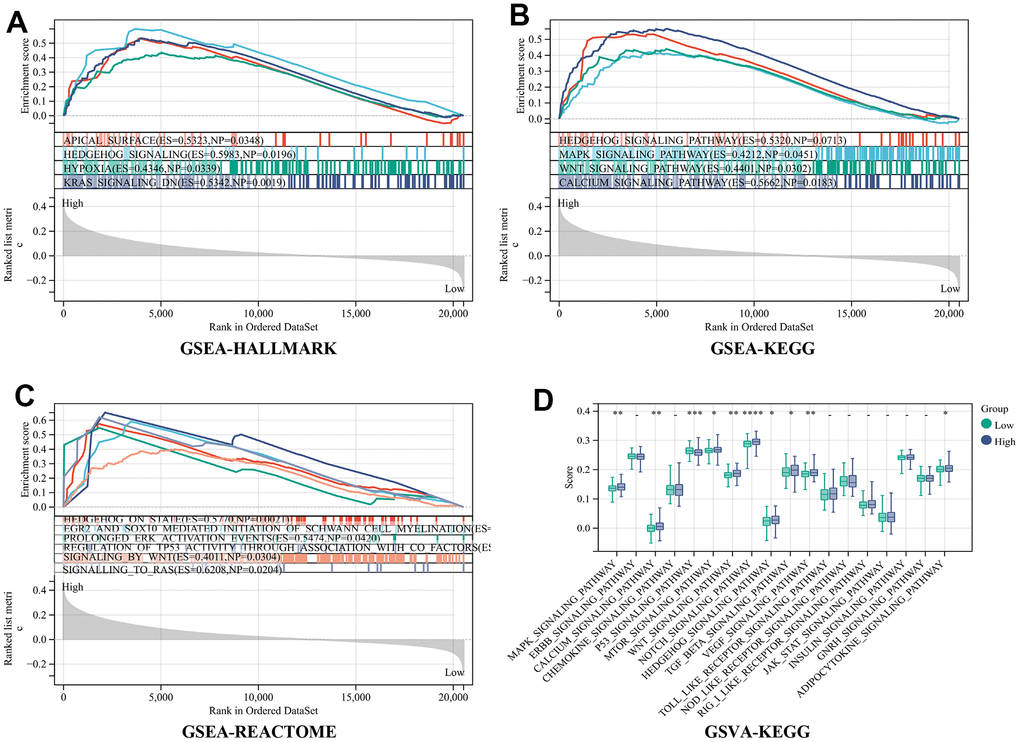
Figure 5.Analysis of RiskScore-related signal pathways. (A) Hallmark (B) KEGG (C) REACTOME enrichment analysis by gene set enrichment analysis (GSEA) (D) KEGG enrichment analysis by the Gene Set Variation Analysis (GSVA).
Figure 5 — Integrative analysis of single-cell and bulk RNA seq to reveal the prognostic model and tumor microenvironment remodeling mechanisms of cuproptosis-related genes in colorectal cancer | Aging