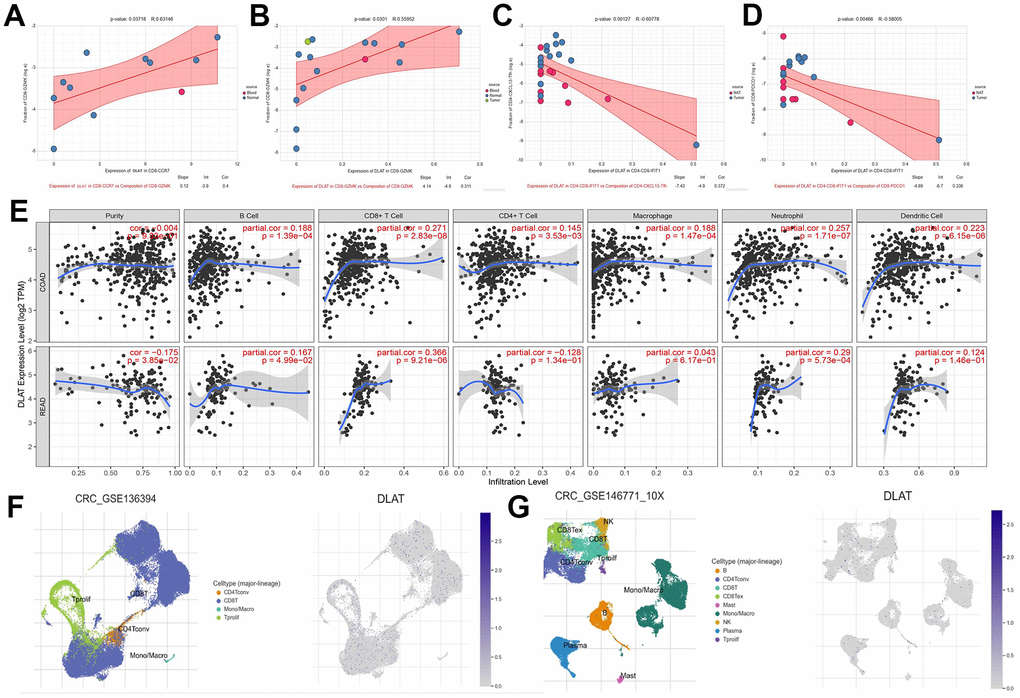
Figure 11.DLAT shapes the positive tumor microenvironment. (A–D) Correlation between expression of DLAT and cell composition (E) DLAT expression and immune cell infiltration. (F) immune cell landscape and DLAT expression distribution after anti-PD-1treatment (G) immune cell landscape and DLAT expression distribution without anti-PD-1 treatment.