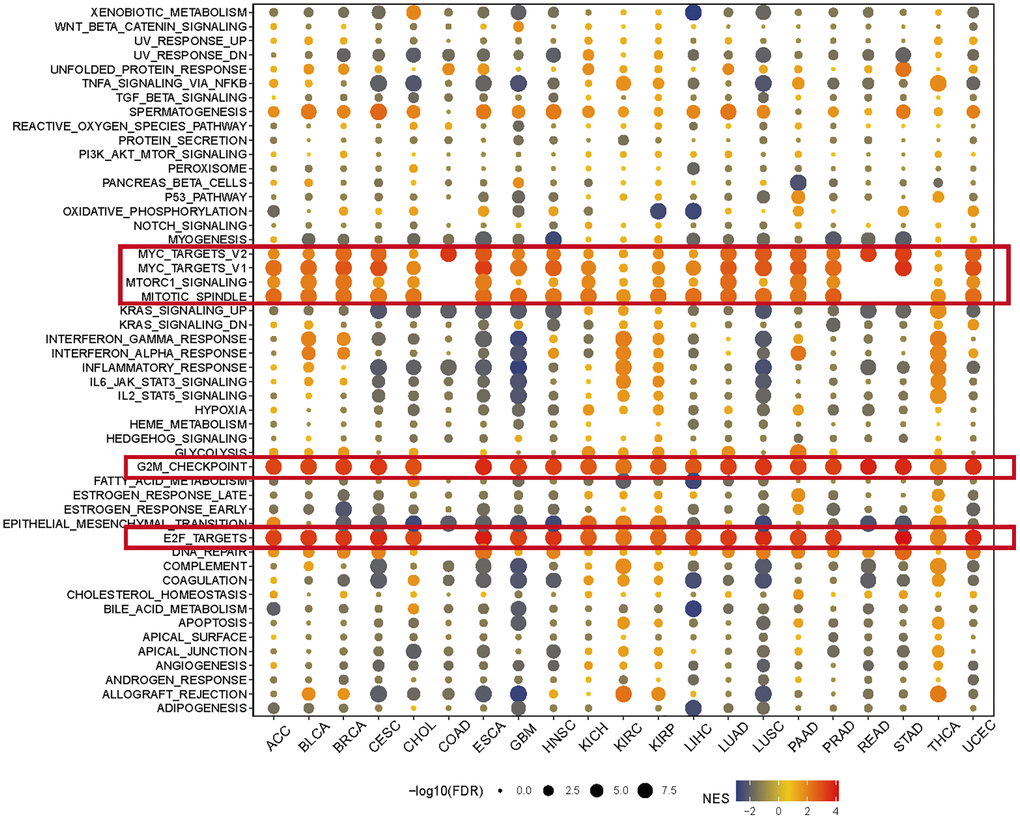
Figure 3.The hallmarks gene set enrichment analysis of KIFC1 in pan-cancer. The size of each circle represents the false discovery rate (FDR) value of the enriched term in each specific cancer, while the color indicates the normalized enrichment score (NES) of the corresponding term.