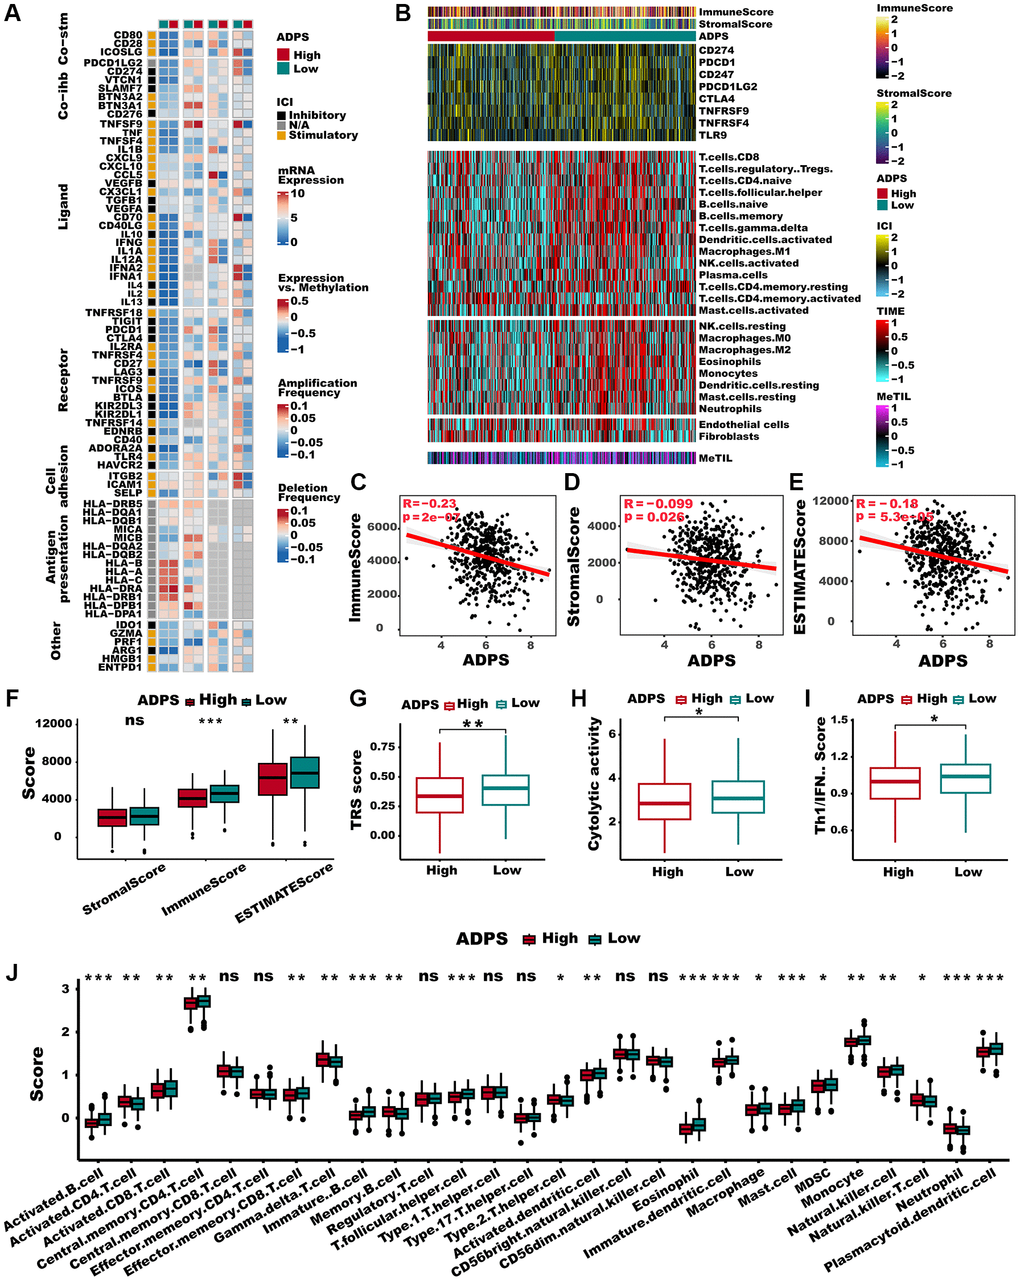
Figure 8.Immune characteristics of the ADPS in the TCGA dataset. (A) The correlation between the ADPS and immune modulators. (B) Heatmap exhibiting the immune score, stromal score, critical checkpoints, and cell types calculated through CIBERSORT analysis of the high and low ADPS groups. (C–E) Correlations between ADPS and immune score (C), stromal score (D), and ESTIMATE score (E). (F) Boxplot of relative stromal, immune, and ESTIMATE score between high and low ADPS groups. (G) Boxplot of relative TRS score between high and low ADPS groups. (H) Boxplot of relative cytolytic activity between high and low ADPS groups. (I) Boxplot of relative Th1/IFN score between high and low ADPS groups. (J) Boxplot of relative infiltrate abundance of 28 immune cell types between high and low ADPS groups. *p < 0.05; **p < 0.01; ***p < 0.001. Abbreviation: ns: not significant.