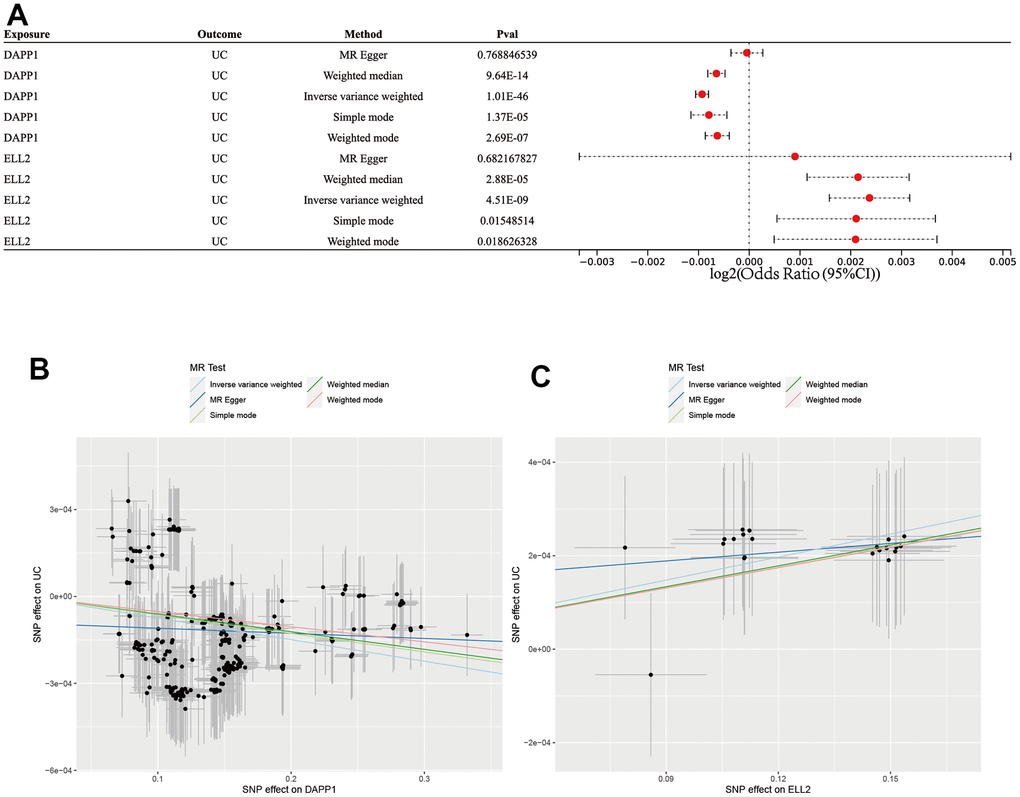
Figure 9.(A) Forest plot showing results from the Mendelian randomization analysis. (B) The scatter plot of five MR methods between DAPP2 and UC. (C) The scatter plot of five MR methods between ELL2 and UC.
Figure 9 — Comprehensive analysis reveals key genes and environmental toxin exposures underlying treatment response in ulcerative colitis based on in-silico analysis and Mendelian randomization | Aging