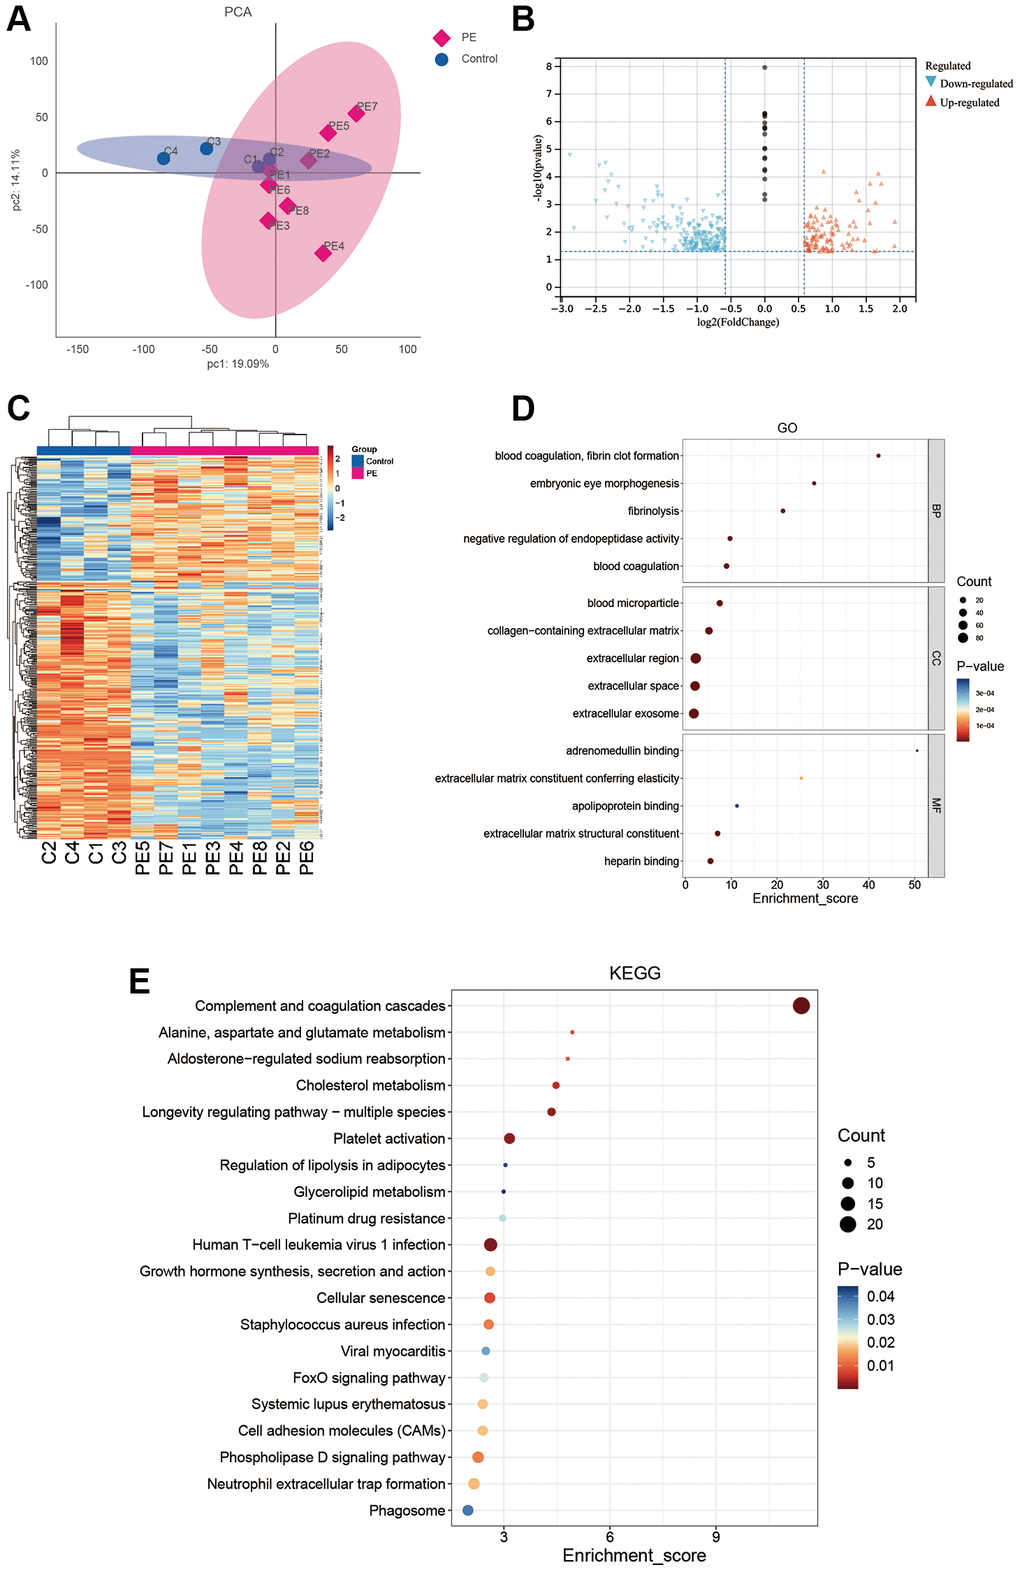
Figure 2.DIA proteomics and functional enrichment analyses. (A) PCA analysis of clinical samples. (B–E) Volcano plot (B), heat map (C), GO enrichment analysis (D), and KEGG enrichment analysis (E) of differentially expressed proteins between the PE group and normal controls.