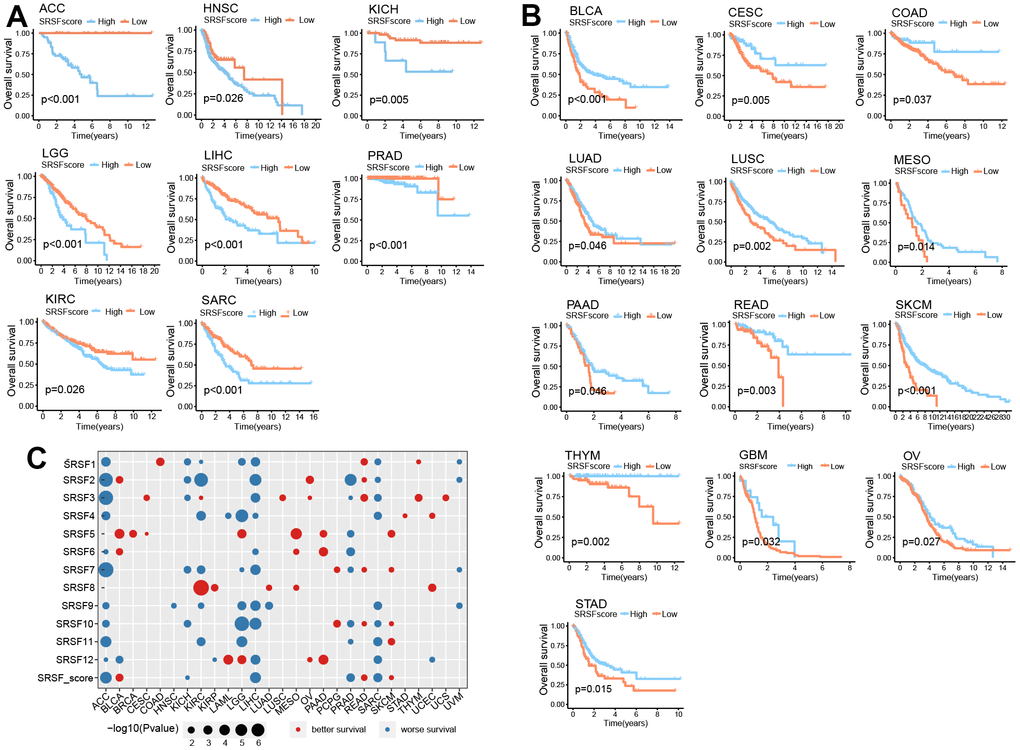
Figure 6.SRSFscore displayed the potential to predict survival in 21 cancer types. (A) Kaplan-Meier survival curves showing high SRSFscore is associated with worse survival in eight cancer types. (B) Kaplan-Meier survival curves showing high SRSFscore is related to better survival in thirteen cancer types. Differences in survival between two groups were tested using the log-rank test. (C) Bubble diagram showing the Cox regression correlation of SRSFs and survival. The diagram only displayed significant dots with P-value <0.05.