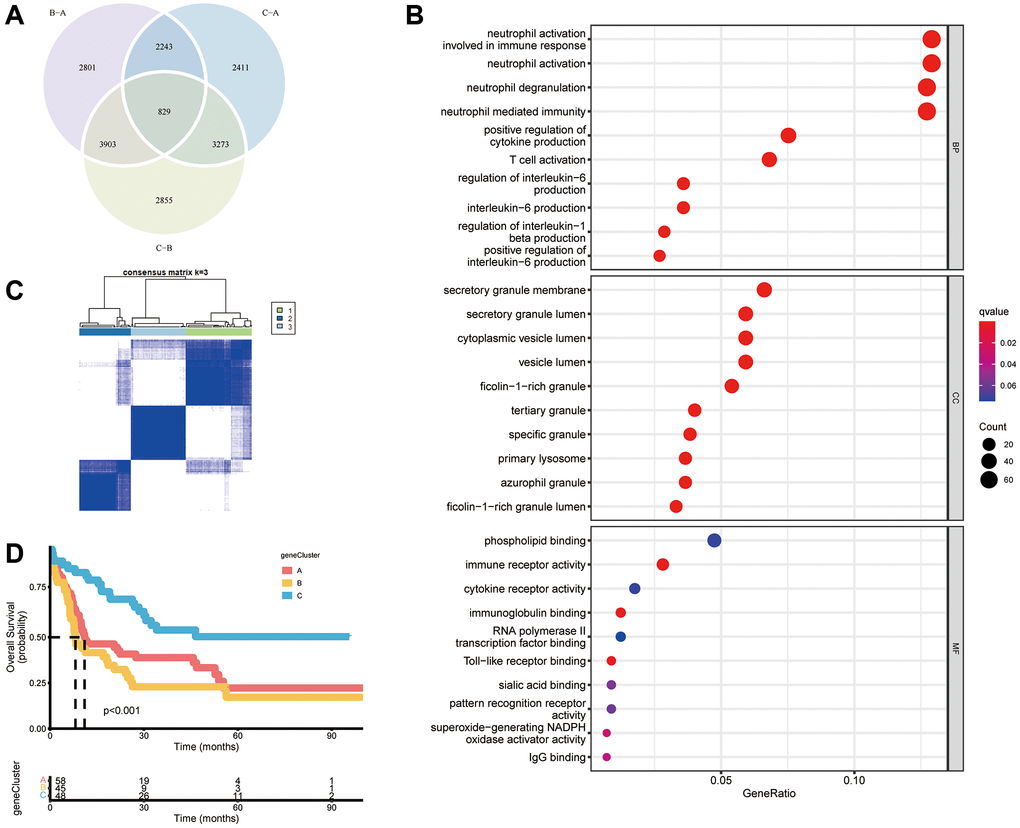
Figure 4.Construction of gene subtypes based on DEGs. (A) Venn diagram of 829 necroptosis-related DEGs among three necroptosis clusters. (B) Analyses of functional enrichment of DEGs using the GO database. (C) Three gene clusters were categorized by a consensus matrix heatmap (k = 3). (D) Kaplan–Meier curves of overall survival for three gene clusters (P < 0.001, log-rank test).