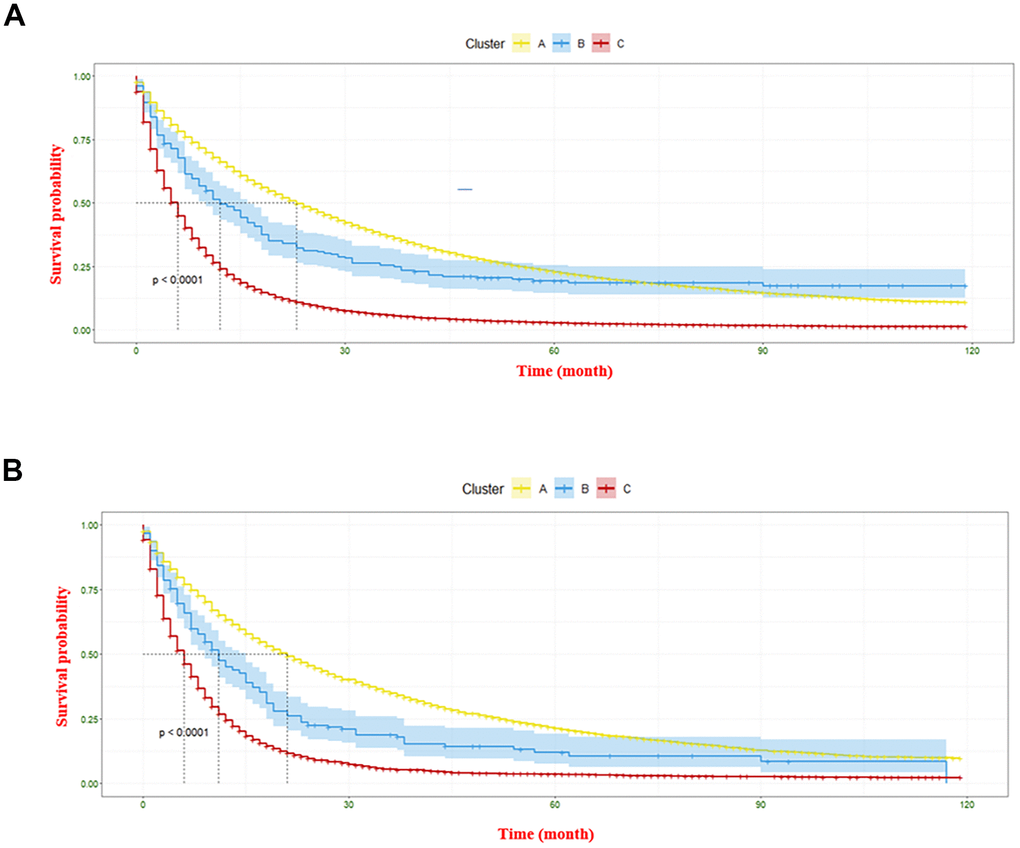
Figure 7.The Kaplan-Meier curve displaying survival differences of three clusters. (A) denotes the information gathered from the construction cohort, and (B) represents the information regarding the validation cohort.
Figure 7 — Prevalence and risk factors of bone metastasis and the development of bone metastatic prognostic classification system: a pan-cancer population study | Aging