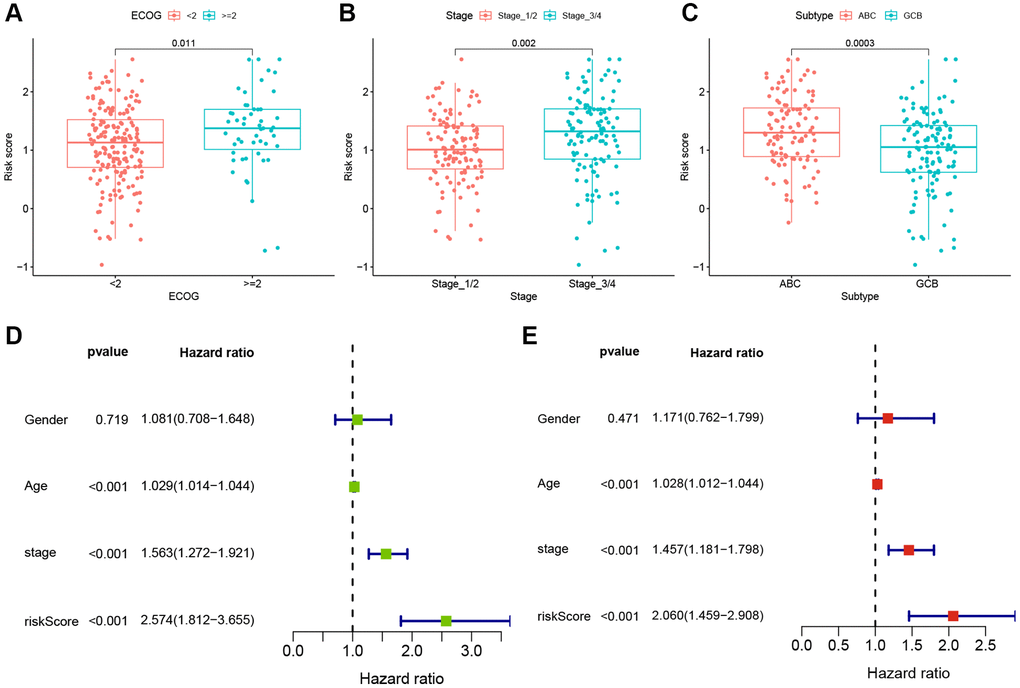
Figure 5.Clinical correlations and independent prognosis value of TRGs risk model. (A–C) TRGs risk scores in different DLBCL subgroups of (A) EOCG, (B) stage and (C) subtype. (D) Univariate Cox regression analysis of TRGs score and clinical features in GSE10846 training cohort. (E) Multivariate Cox regression analysis of TRGs score and clinical features in GSE10846 training cohort.