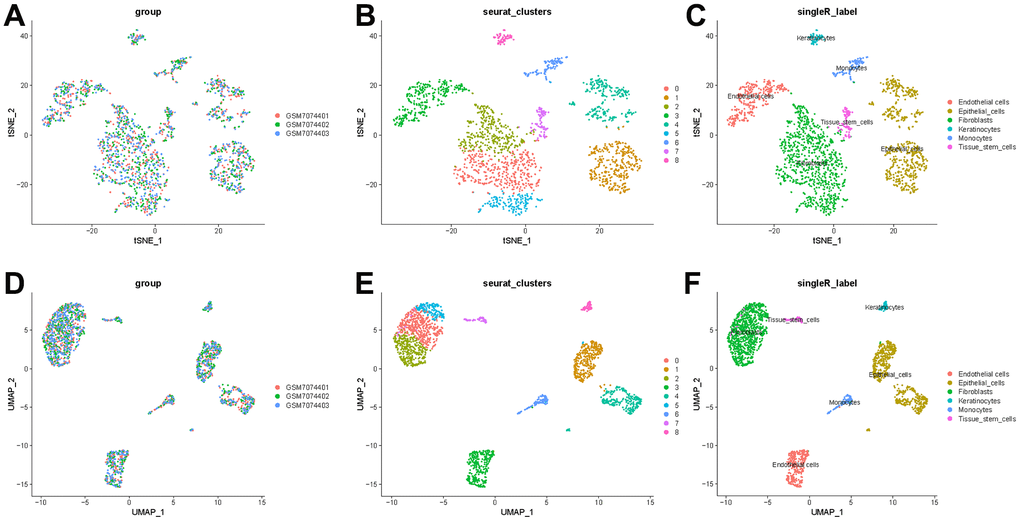
Figure 4.t-SNE and UMAP clustering of normal breast samples. (A) Inter-tumor heterogeneity of triple-negative breast cancer by t-SNE method. (B, C) Clusters and cell type annotations at the single-cell level in TNBC samples by t-SNE method. (D) Inter-tumor heterogeneity of triple-negative breast cancer by UMAP method. (E, F) Clusters and cell type annotations at the single-cell level in TNBC samples by UMAP method.