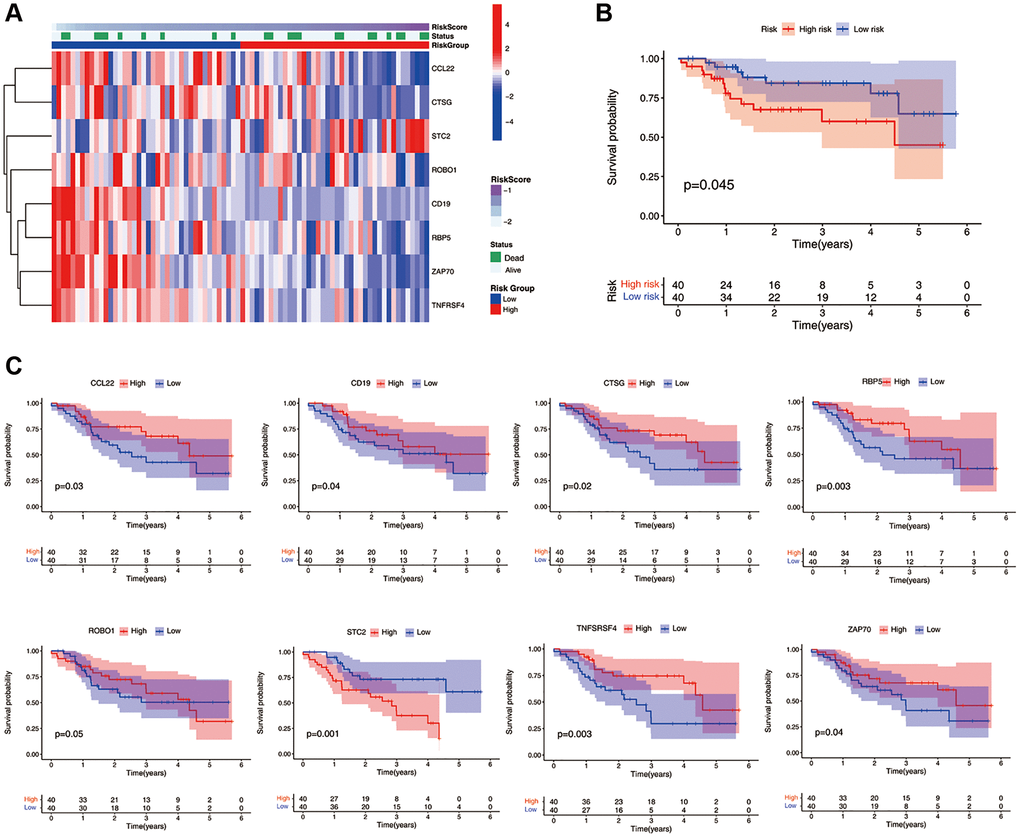
Figure 3.Validation of the ICF gene signature in Qilu cohort. (A) The heatmap illustrates the expression levels of eight ICF signature genes in the Qilu cohort. (B) Kaplan-Meier survival analysis demonstrates the survival outcomes of the high- and low-risk groups in the Qilu cohort. (C) Kaplan-Meier survival analysis stratified by the expression levels of eight ICF signature genes in the Qilu cohort.