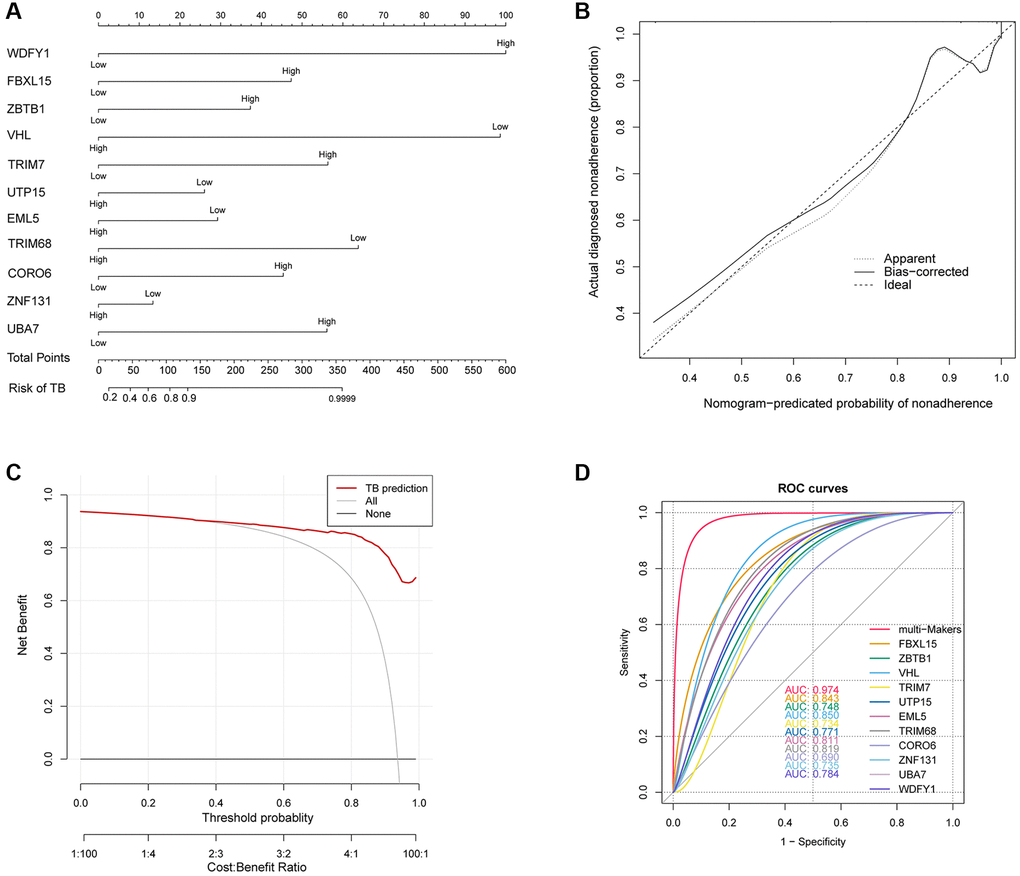
Figure 5.(A) Developed nonadherence nomogram. (B) The calibration curves for predicting nonadherence using the nomogram in the cohort are illustrated. (C) Decision curve analysis for the nomogram. (D) ROC curve of Ub-related hub genes in TB diagnosis.