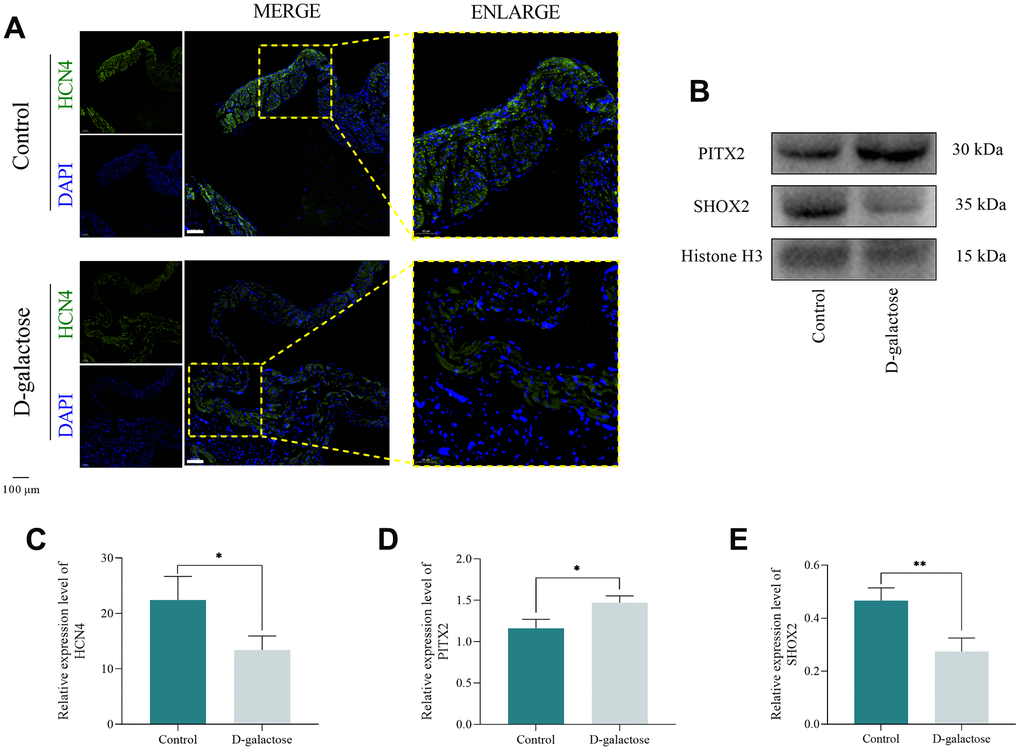
Figure 6.Oxidative stress causes If channel abnormality. (A) Immunofluorescence staining of the SAN. Scale = 100 μm. (B) Western blotting assay. (C) Results of immunofluorescence staining. (D, E) Results of Western blotting assay. * represents P<0.05; ** represents P<0.01; Control: control group; D-galactose: D-galactose administered group.