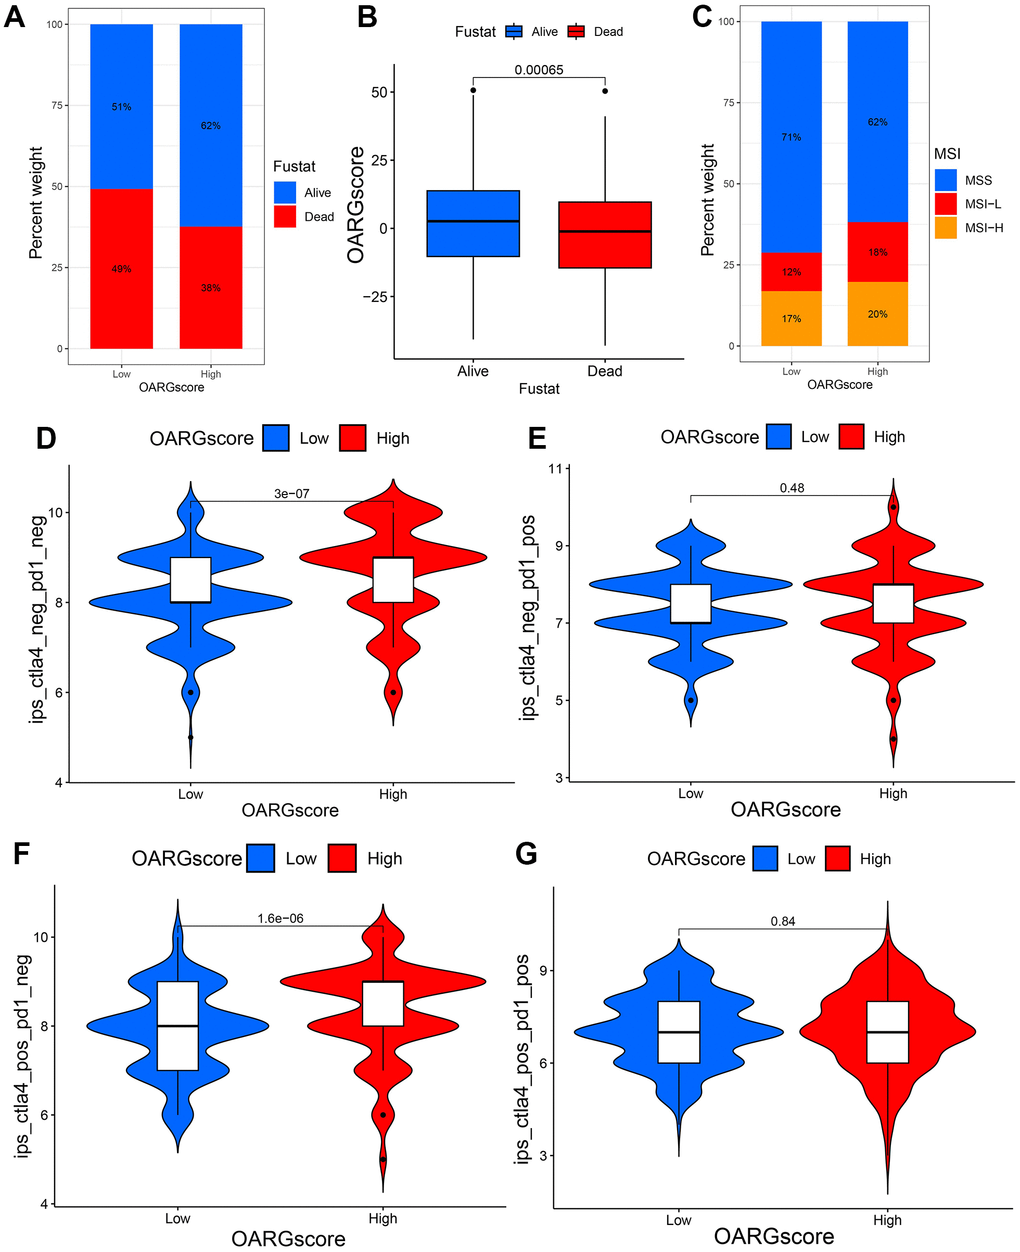
Figure 8.OARGscore in the role of immunotherapy. (A, B) The percentage of patients who survived in groups with low- and high-OARGscore. (C) The proportion of MSI grouping in low and high-OARGscore groups. (D–G) A comparison of the IPS relative distribution across groups with low- and high-OARGscore.