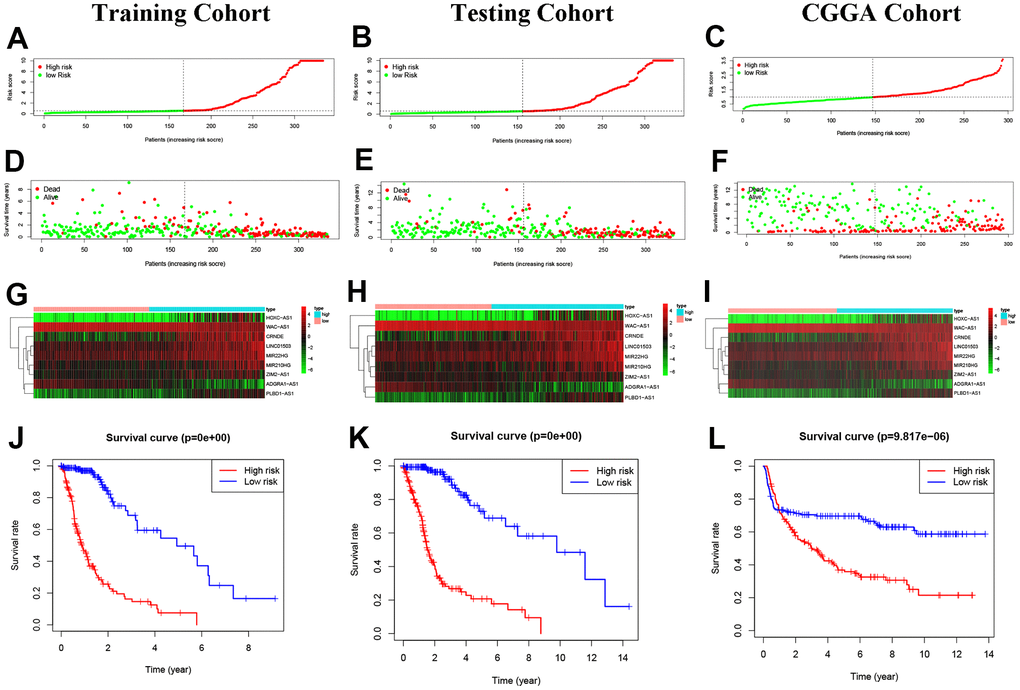
Figure 4.Construction of predictive risk model in glioma patients. (A–C) The two risk groups risk in the three cohorts. (D–F) The survival status of glioma patients. (G–I) The heatmap of 9 NRLs. (J–L) The Kaplan-Meier analysis.
Figure 4 — A systematic framework for identifying prognostic necroptosis-related lncRNAs and verification of lncRNA CRNDE/miR-23b-3p/IDH1 regulatory axis in glioma | Aging