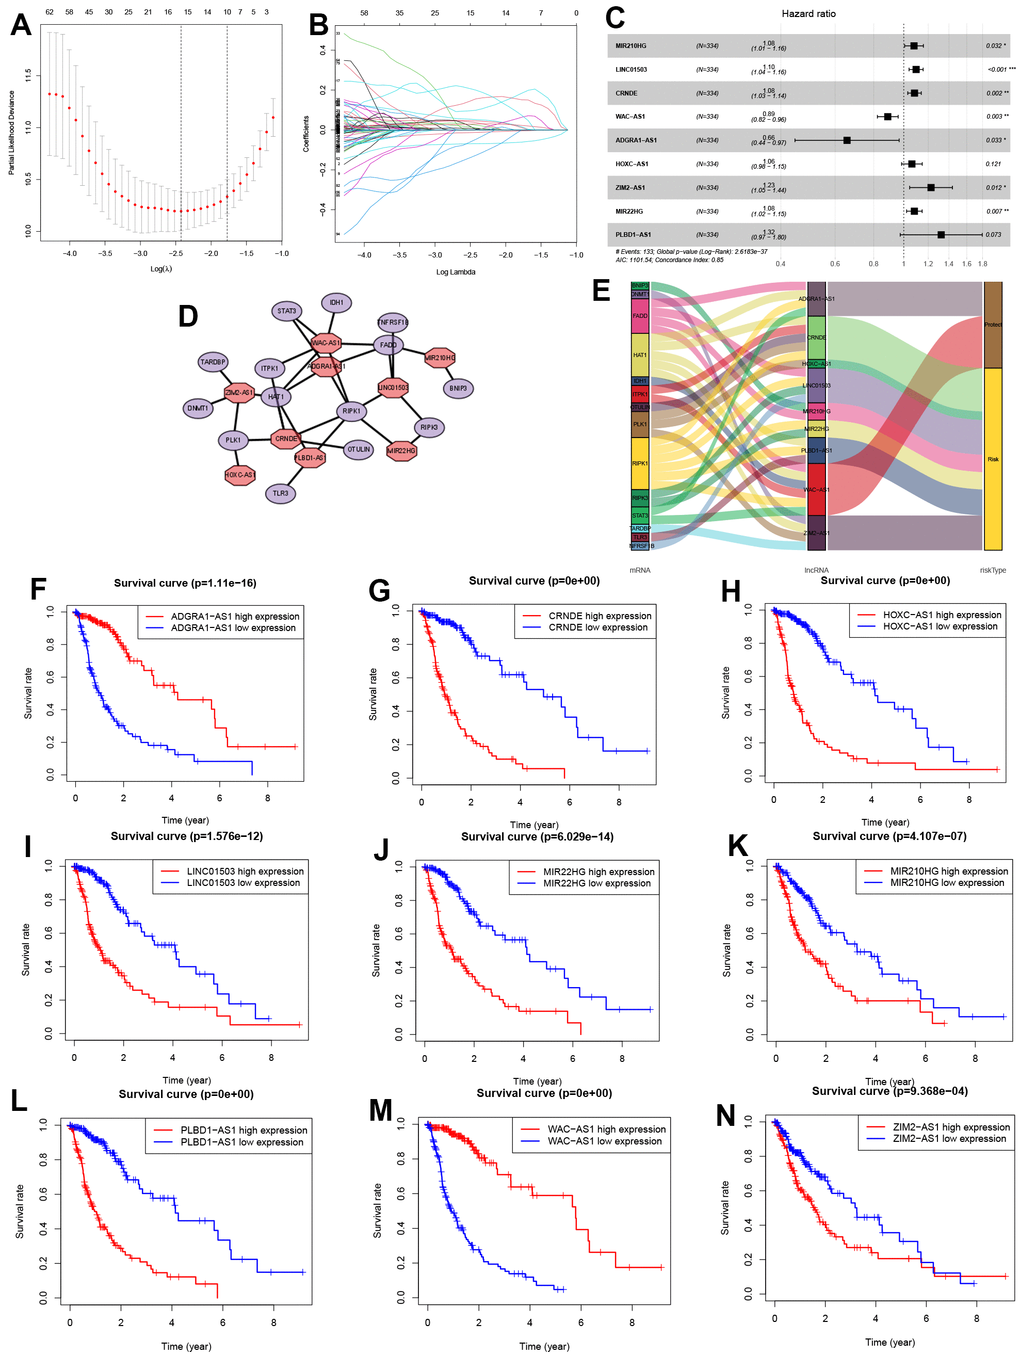
Figure 3.Identification of NRLs and their subsistence analysis. (A, B) LASSO Cox algorithm. (C) The risk model of 9 NRLs. (D) The co-expression structure. (E) Sankey diagram. (F–N) The Kaplan-Meier analysis of 9 NRLs.
Figure 3 — A systematic framework for identifying prognostic necroptosis-related lncRNAs and verification of lncRNA CRNDE/miR-23b-3p/IDH1 regulatory axis in glioma | Aging