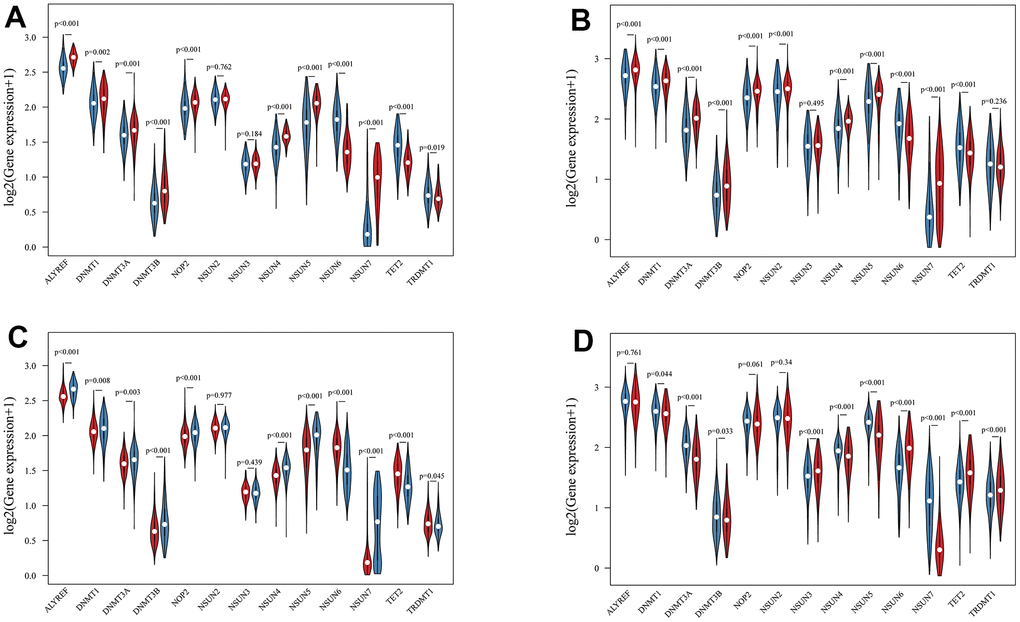
Figure 1.The landscape of m5C RNA methylation regulators in glioma. (A, B) Vioplots visualized the differentially expressed m5C regulators between LGG and GBM in TCGA (A) and CGGA (B). (blue represents LGG and red represents GBM). (C, D) Vioplots visualized the differentially expressed m5C regulators with IDH status in TCGA (C) and CGGA (D). (blue represents wild type and red represents mutation type).