Submit an Article
Navigate
Home
Editorial Board
Editorial Policies
Current Volume
Archive
Scientific Integrity
Publication Ethics Statements
Interviews with Outstanding Authors
Newsroom
Sponsored Conferences
Podcast
Contact
Special Collections
Submit an Article
Online ISSN: 1945-4589
Research Paper
|
Volume 15, Issue 21
|
pp. 12192–12208
N7-methylguanosine-related miRNAs predict hepatocellular carcinoma prognosis and immune therapy
Back to article
Figure 4
(4 of 9)
−
100%
+
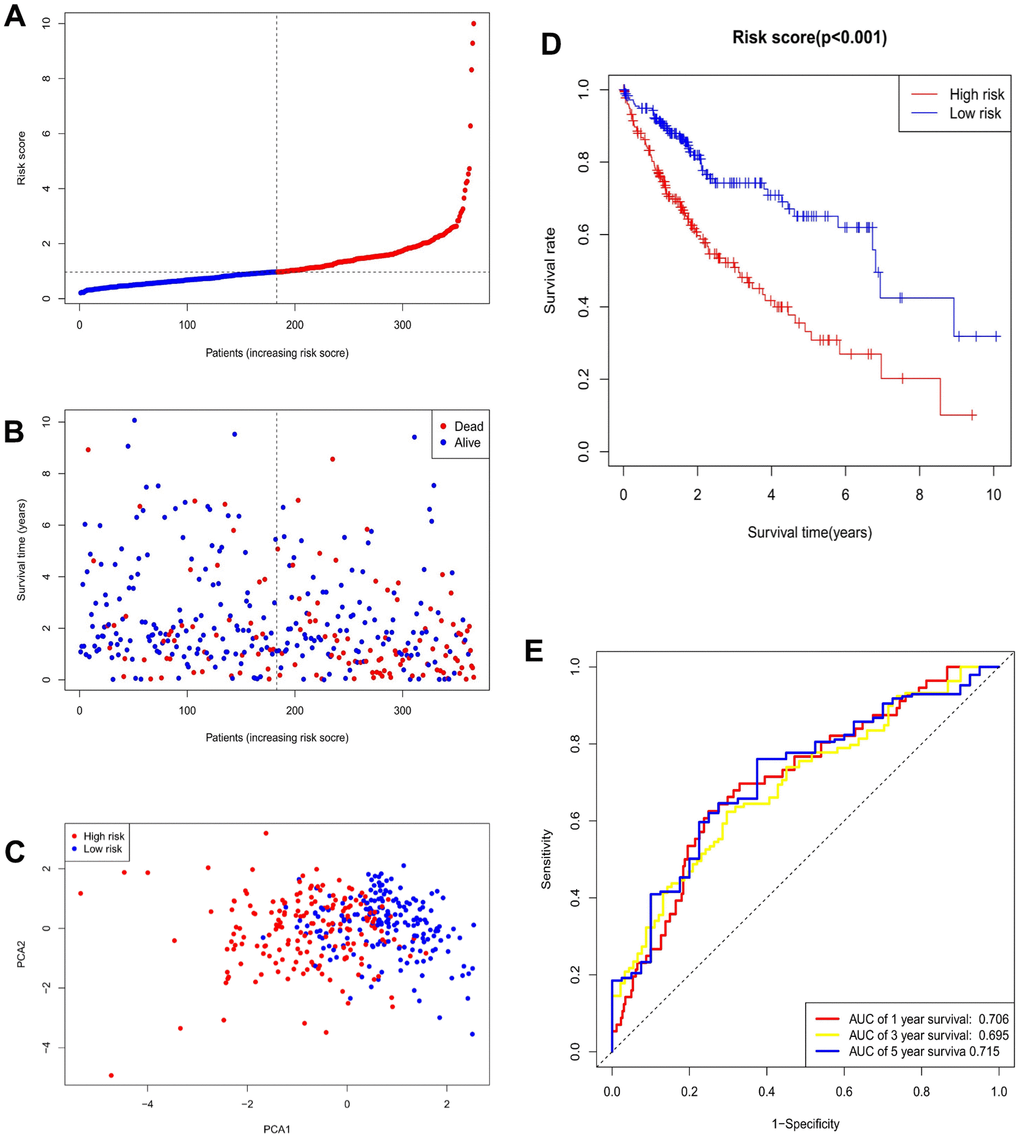
Figure 4.
Validation of prognostic models for seven m
7
G-related miRNAs.
(
A
) Risk score distribution. (
B
) Survival status. (
C
) PCA plot. (
D
) Survival curve for low- and high-risk groups. (
E
) ROC curve for 1-, 3-, and 5-year overall survival.