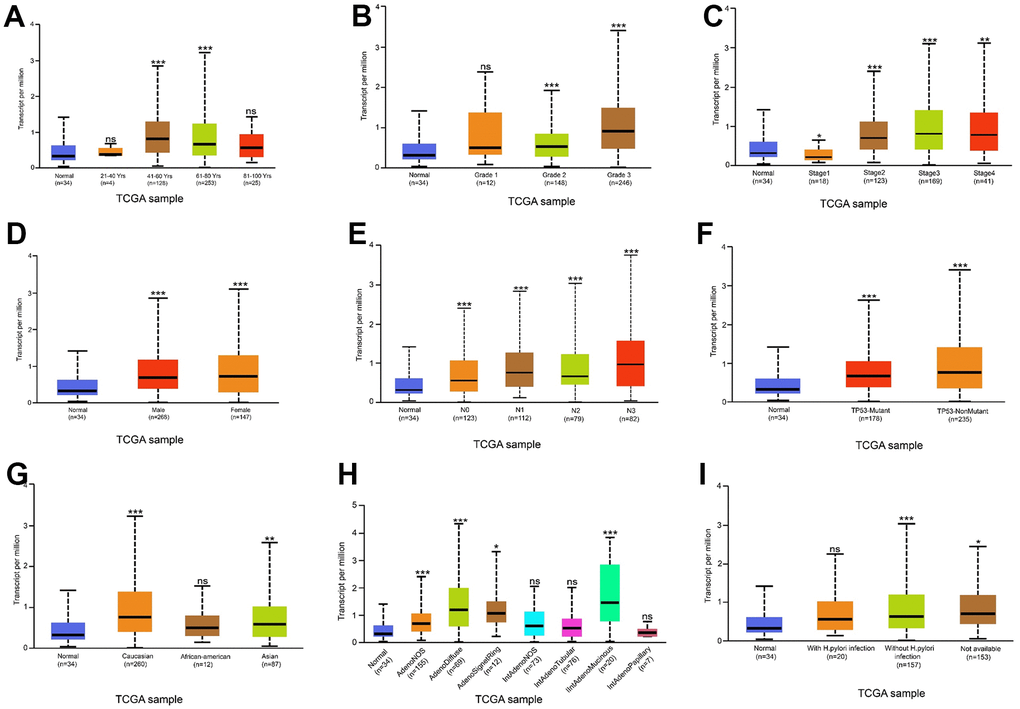
Figure 2.Relationship between THSD7A expression and clinical characteristics. Relationship between THSD7A expression and age (A), grade (B), stage (C), sex (D), lymph node metastasis stage (E), TP53 mutation (F), ethnicity (G), histological subtypes (H) and Helicobacter pylori infection (I) (*: P<0.05, **: P<0.01, ***: P<0.001, ns: P>0.05). (Normal is the control group.)