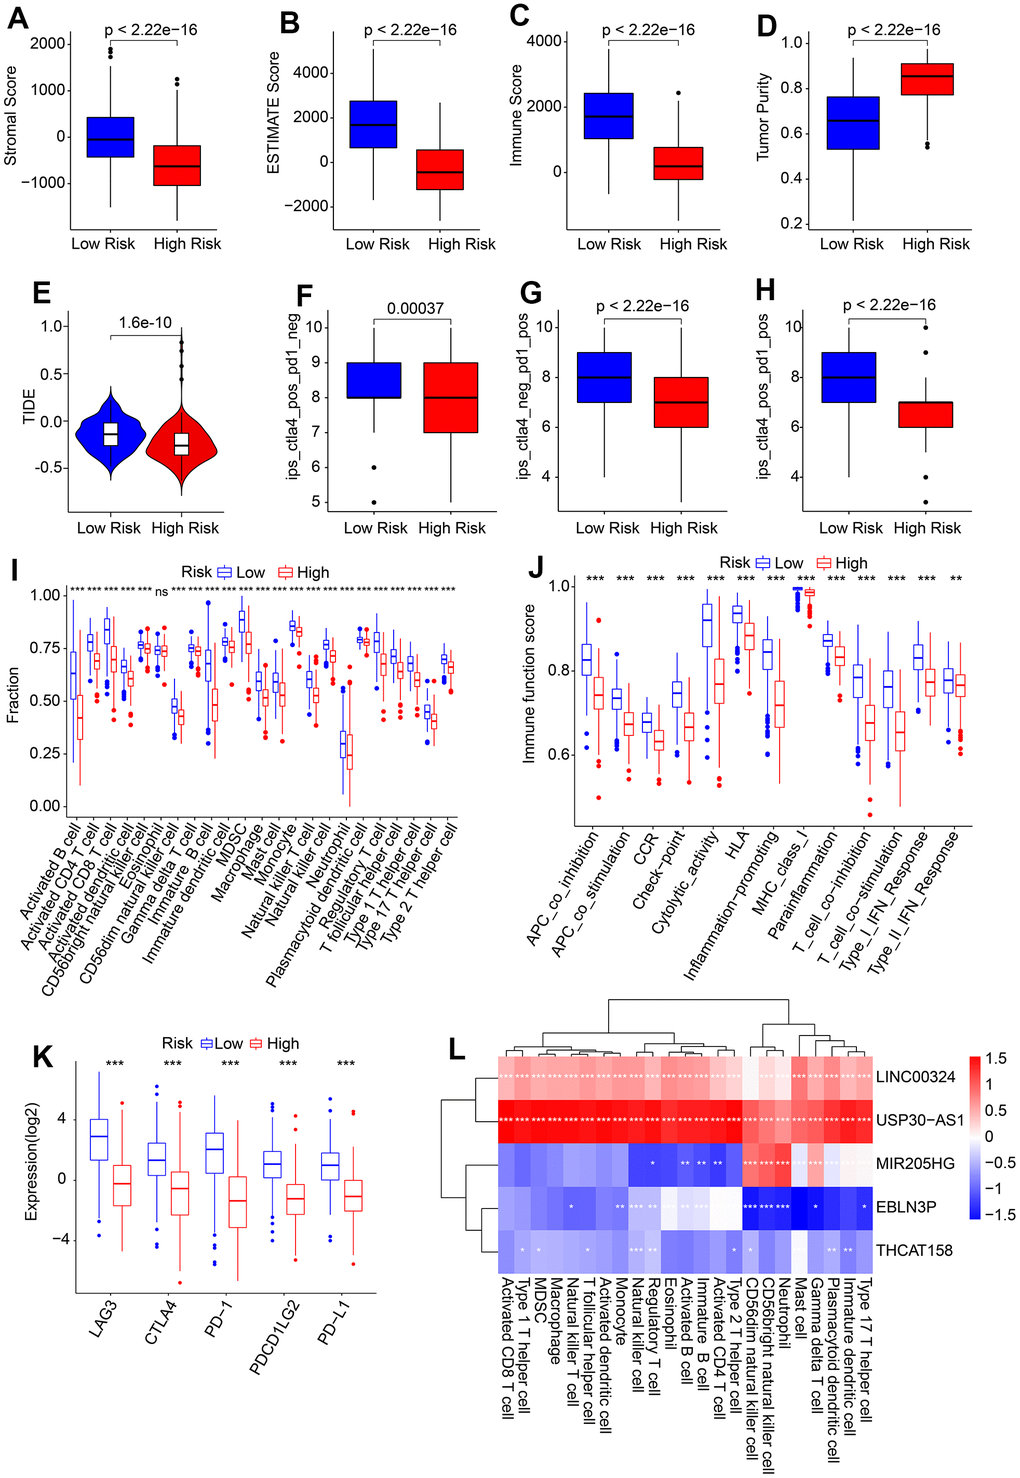
Figure 7.Association of risk score and immune infiltration landscape in CM. (A–D) Stromal, immune, ESTIMATE scores, and tumor purity. (E) TIDE score. (F–H) IPS score. (I) The proportion of 23-type immune cells of patients in the low- and high-risk group. (J) Immune function score. (K) Expression of immune checkpoints inhibitor (ICI) of in low- and high-risk group. The expression of ICI was transformed by log2 (expression + 1). (L) Correlation analysis of 5 prognostic HRLs and 23-type immune cells.