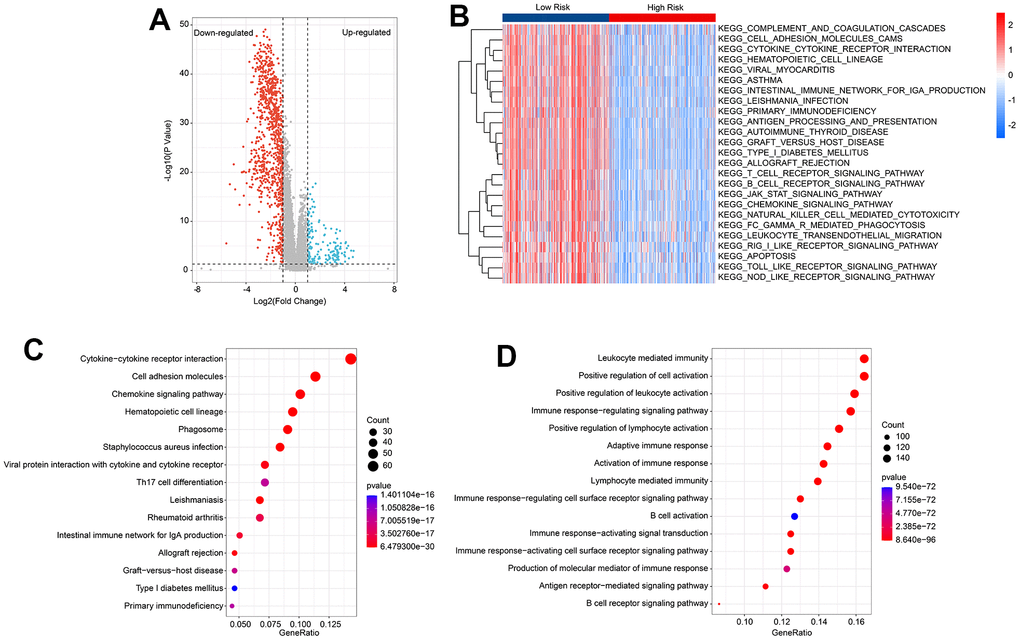
Figure 5.Functional enrichment analysis of differential expression genes (DEGs) in low- and high-risk group. (A) Volcano diagram shows the DEGs in the low- and high-risk group with the threshold set at |Fold Change| ≥ 2 and P < 0.05. (B) GSVA reveals the activity of KEGG signal pathways of each CM patient in the low- and high-risk group. (C) KEGG enrichment analysis of DEGs. (D) GO enrichment analysis of DEGs.