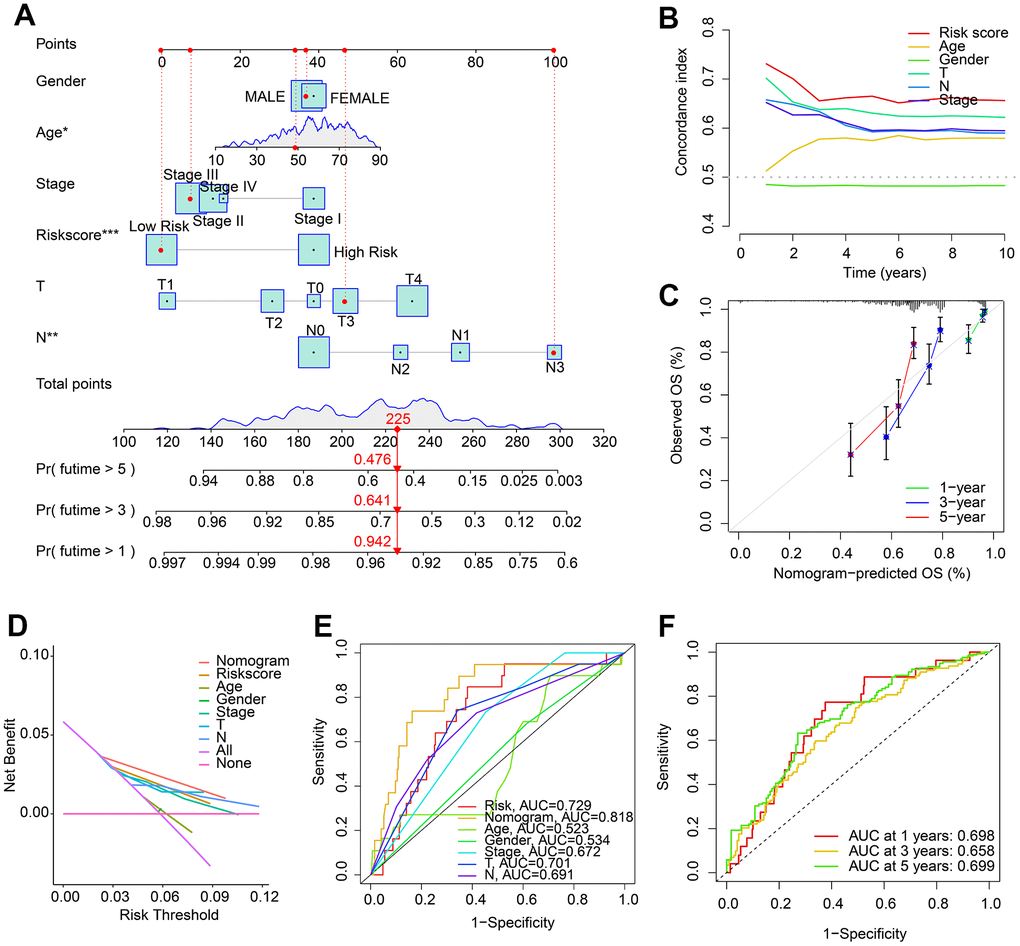
Figure 4.Nomogram construction based on HRLs prognostic signature and clinicopathological characteristics. (A) Construction of nomogram model to predict 1-, 3-, and 5-years survival probability of patients with CM. (B) Concordance index curve of risk score and clinicopathological characteristics. (C) Calibration curve reveals the consistence of nomogram-predict OS and actual OS. (D) Decision curve analysis (DCA). (E) ROC curve shows the AUC of nomogram, risk score, and clinicopathological characteristics. (F) Time-dependent ROC curve shows the AUC of 1-, 3-, and 5-years.