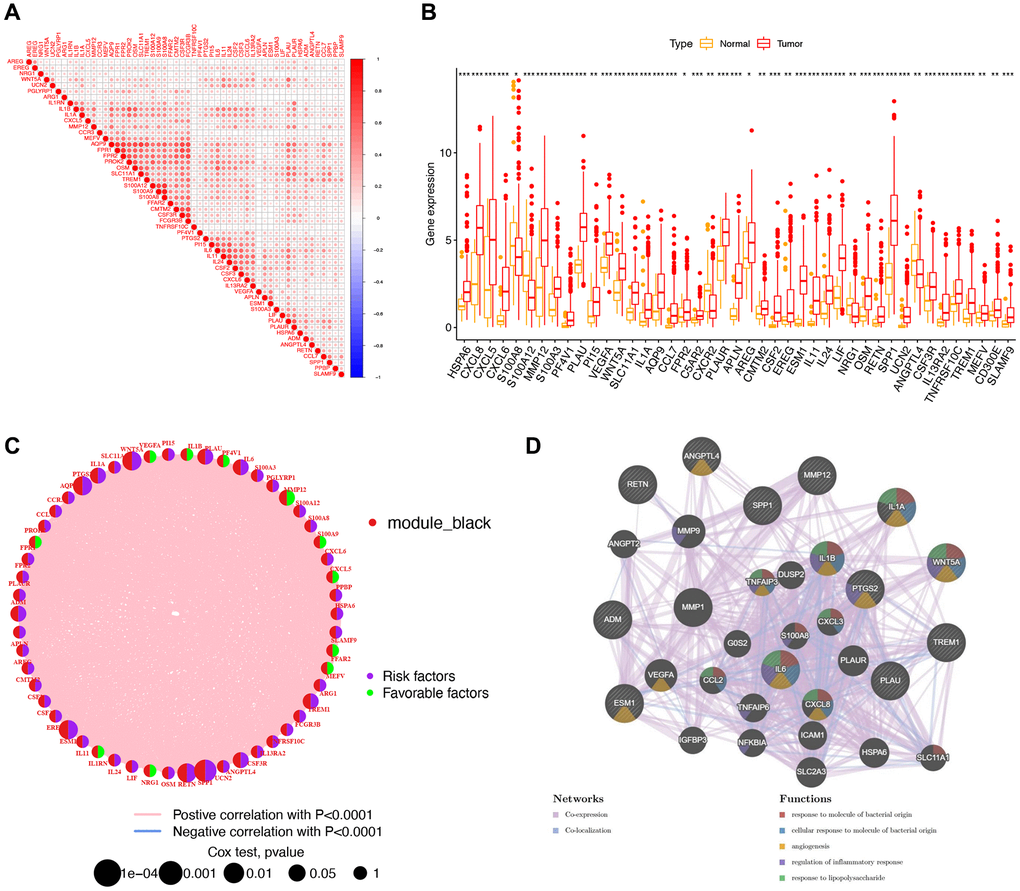
Figure 2.A study of 60 immune-related genes (IRGs) in stomach adenocarcinoma (STAD). (A) Triangle heat map showing correlation analysis of 60 IRGs. (B) Box plot comparing gene expression in normal and tumor groups. ***p < 0.001; **p < 0.01; *p < 0.05. (C) Network graph, in which nodes represented IRGs, and node size represented the relationship between genes and survival. The left semicircle of the node represented module_black. The green right semicircle showed low-risk genes, and the purple right semicircle showed high-risk genes. (D) Visualization of the co-expression network, in which the nodes represent genes, and the size of the nodes represented the number of connected genes.