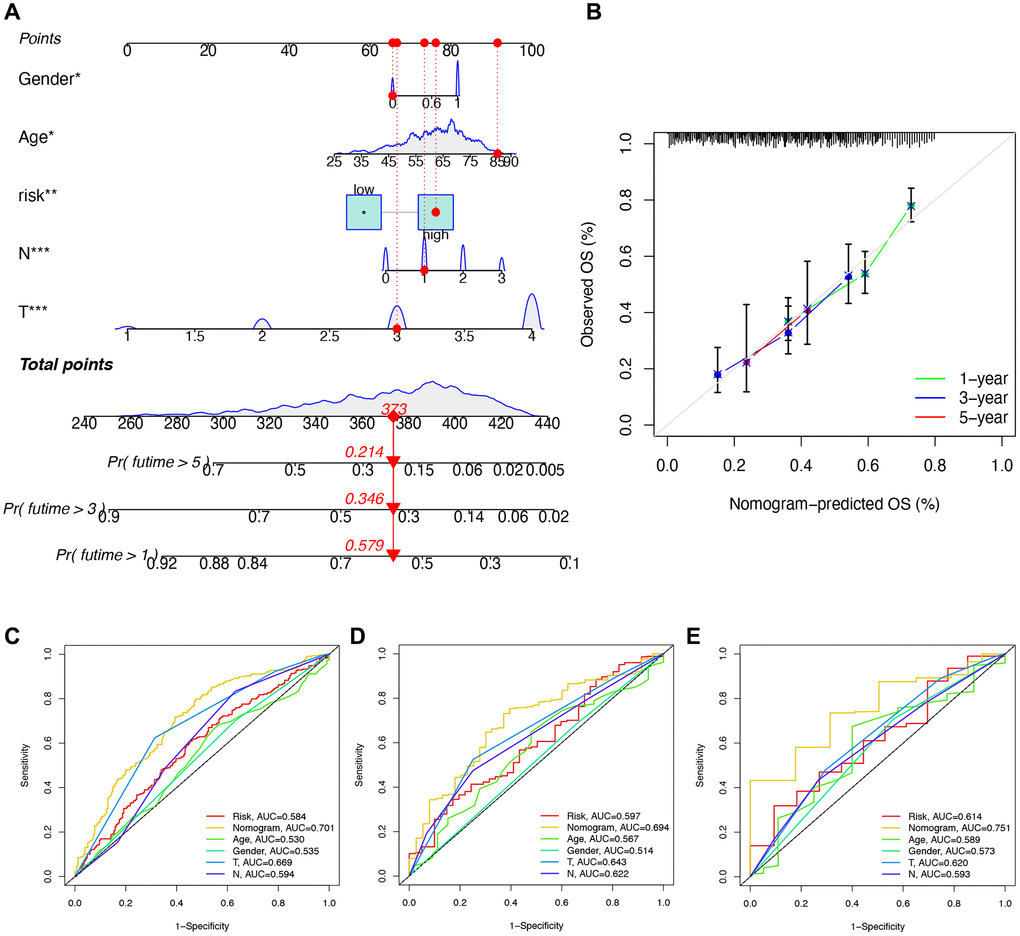
Figure 11.Construction and validation of a nomogram. (A) Nomogram for getting the score of each clinical trait and calculating the comprehensive score, further predicting the survival of the patient. (B) Calibration curve of the nomogram to predict the one-year, three-year, five-year survival rate. (C–E) ROC curve for validating the accuracy of predicting survival by building the signature.