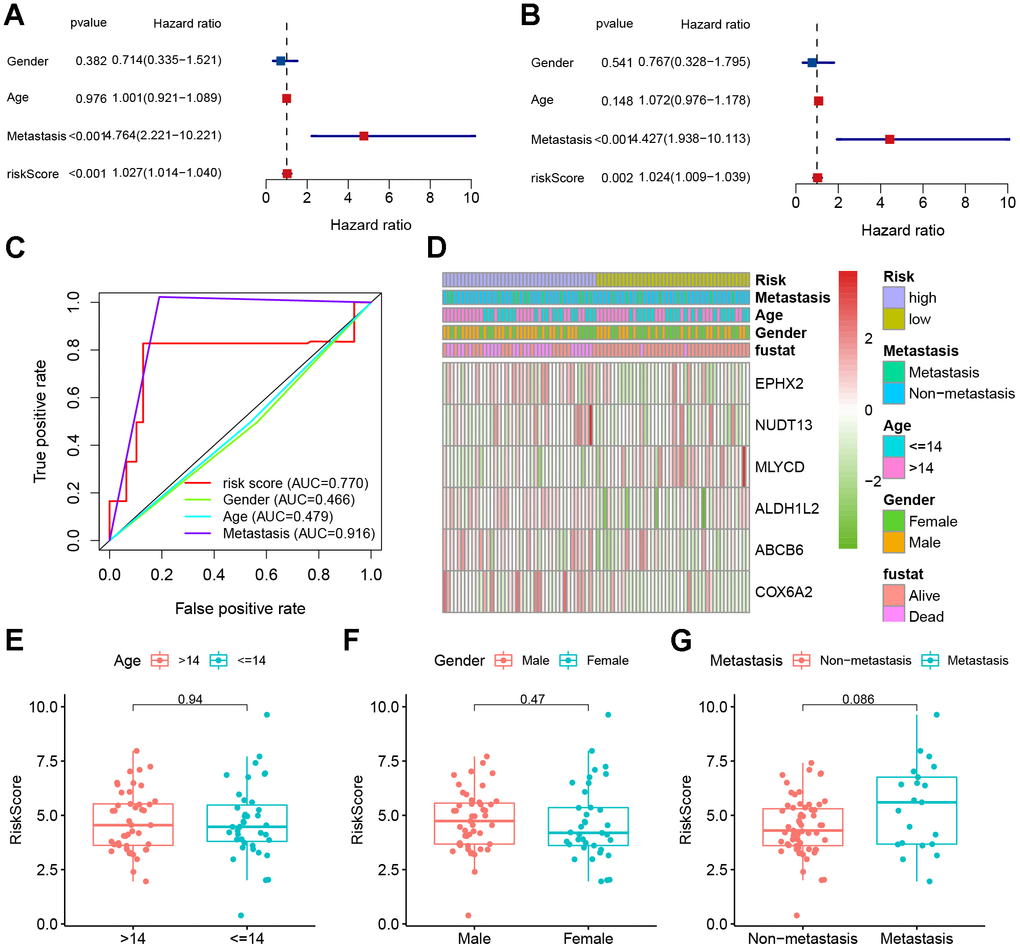
Figure 6.Clinical correlation analyses. (A) Univariate Cox analysis. (B) Multivariate Cox analysis. (C) AUC value predicts clinical characteristics and risk score. (D) Heatmap and the clinical characteristics of the two groups. (E–G) Relationship between risk score and clinical pathological factors.