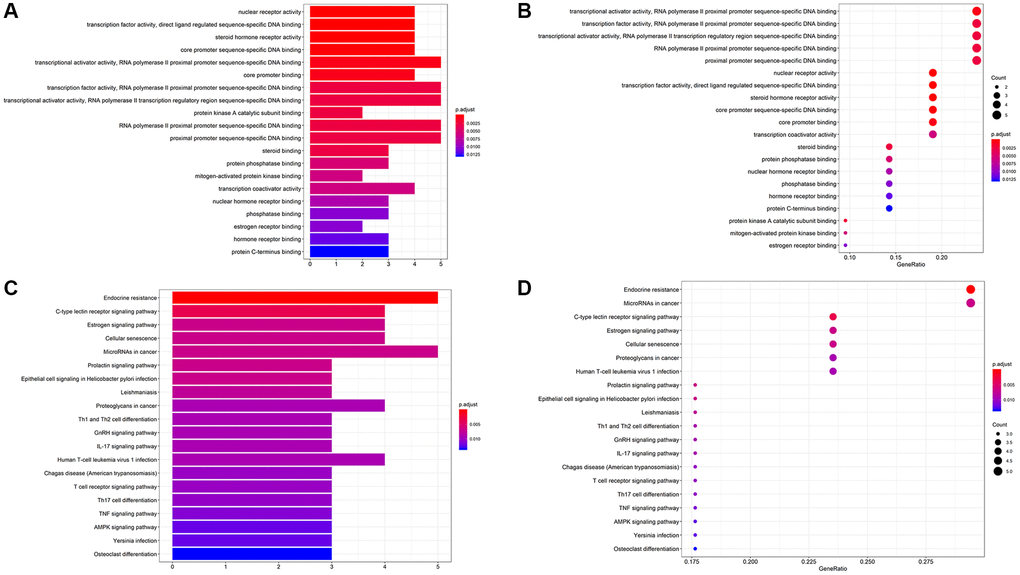
Figure 6.(A, B) The bar chart and bubble chart showing top 20 GO ID. (C, D) The bar chart and bubble chart showing the top 20 KEGG pathways of potential target genes of Form in OS.
Figure 6 — Anti-cancer targets and molecular mechanisms of formononetin in treating osteosarcoma based on network pharmacology | Aging