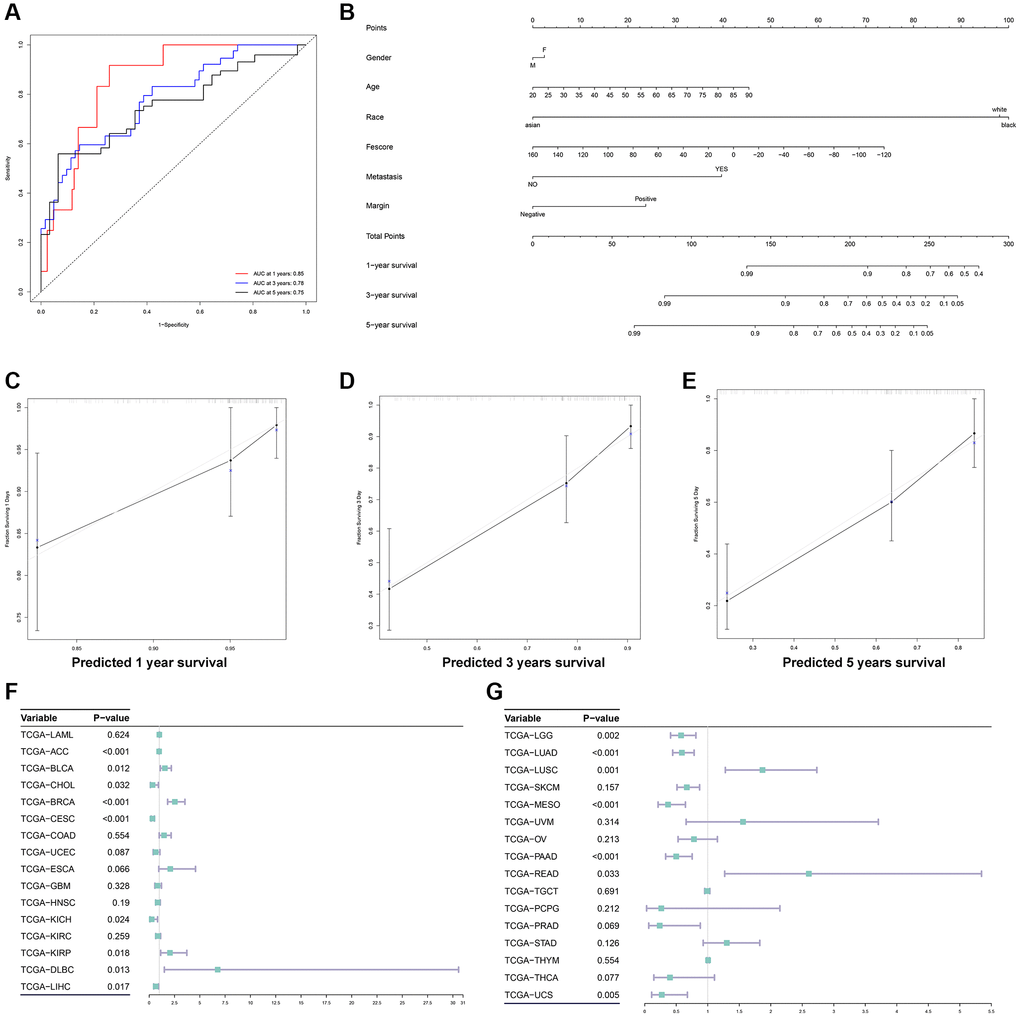
Figure 8.Construction of a prognostic nomogram and validation of the Fescore in multiple tumors. (A) ROC curve of Fescore for predicting the 1-year, 3- and 5-years survival of STS. (B) The prognostic nomogram based on gender, age, race, metastasis, margin status and Fescore for predicting the prognosis of STS. (C–E) The calibration curve of 1-year, 3- and 5-years survival of STS. (F, G) Validation of Fescore across 33 types of tumors.