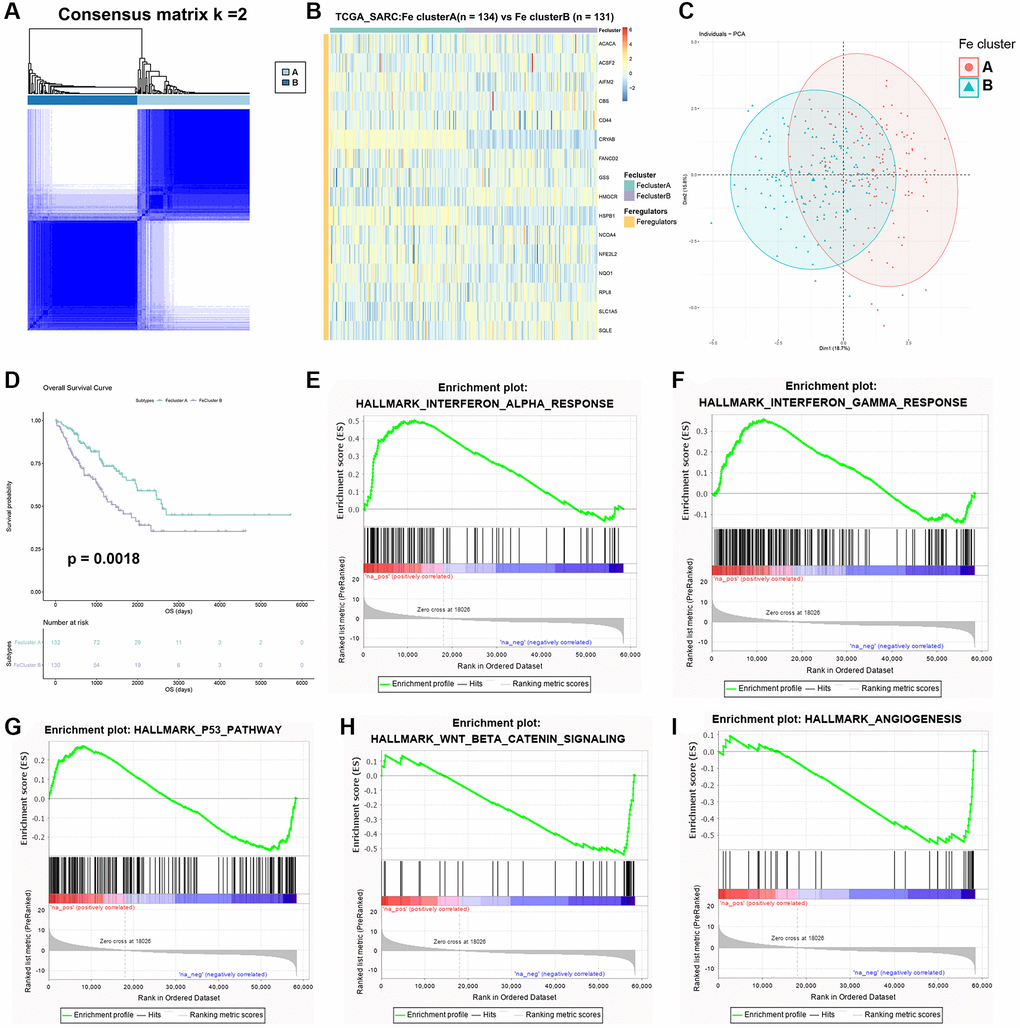
Figure 5.Identification of two ferroptosis modification patterns in STS. (A) The result of consensus clustering analysis in STS. (B) Heatmap of expression of 16 ferroptosis regulators in Fe clusters A and B. (C) The result of PCA of two Fe clusters. (D) Survival plot of two clusters in TCGA-SARC (p = 0.0018). (E) Enriched pathways in Fe cluster A: α interferon response. (F) Enriched pathways in Fe cluster A: γ interferon response. (G) Enriched pathways in Fe cluster A: p53 pathway. (H) Enriched pathways in Fe cluster B: WNT signaling. (I) Enriched pathways in Fe cluster B: angiogenesis.