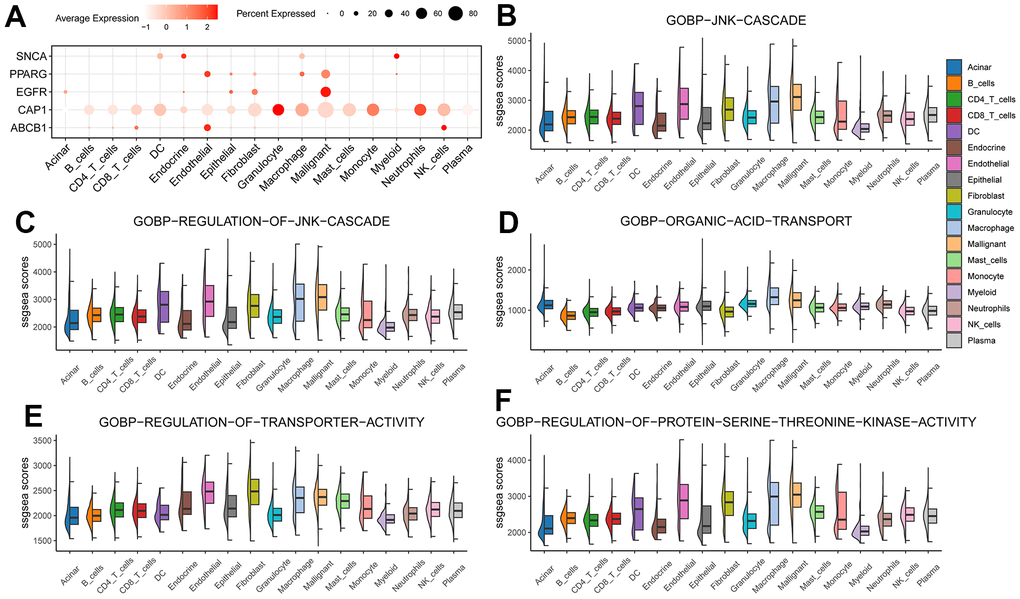
Figure 10.Hub gene was analyzed at the single-cell level. (A) Hub gene expression in individual cell types; (B–F) 5 BP enrichment scores in each cell type.
Figure 10 — Exosome and lipid metabolism-related genes in pancreatic adenocarcinoma: a prognosis analysis | Aging