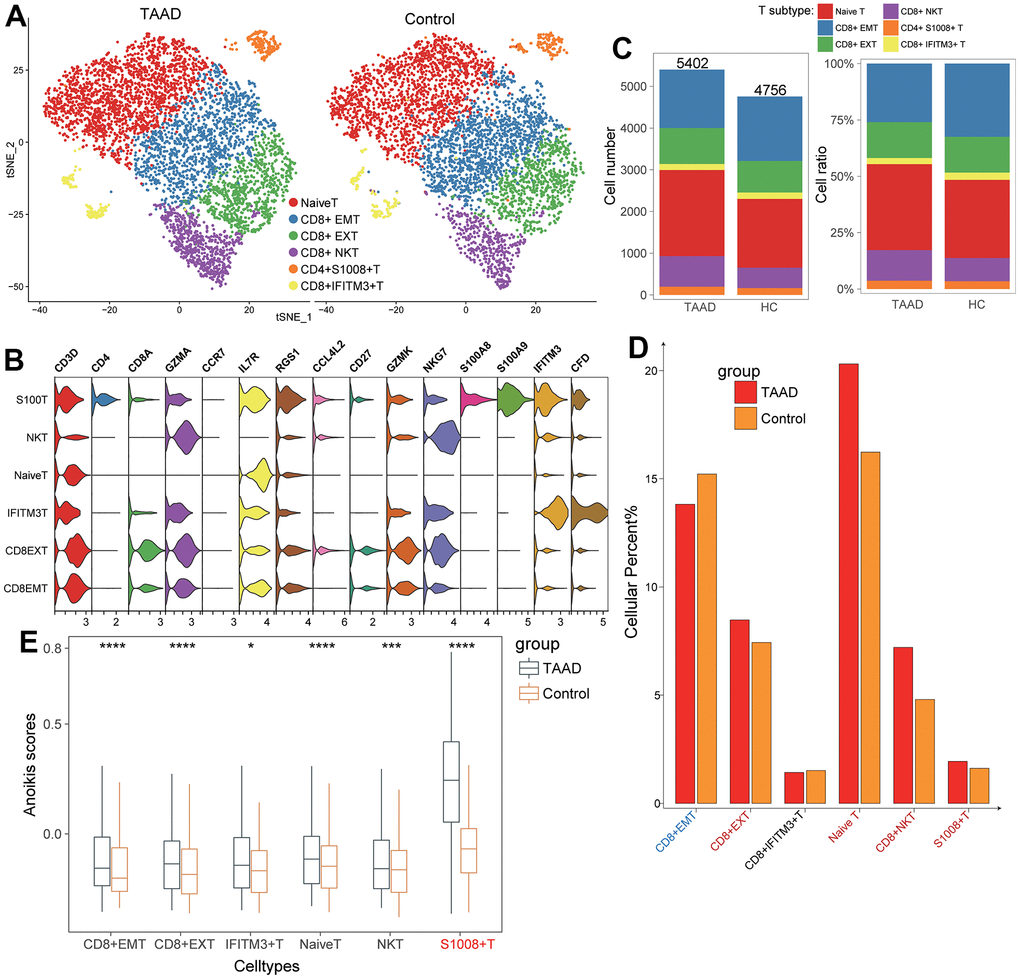
Figure 6.Validation of T cells subtypes for ssGSEA algorithm. (A) Identification of six T-cell subtypes between TAAD and HC; (B) The corresponding cellular markers with high-expression in each cell; (C, D) The comparison of cellular numbers and ratio between TAAD and HC in each cell; (E) The comparison of anoikis scores between TAAD and HC in different T cell subtypes.