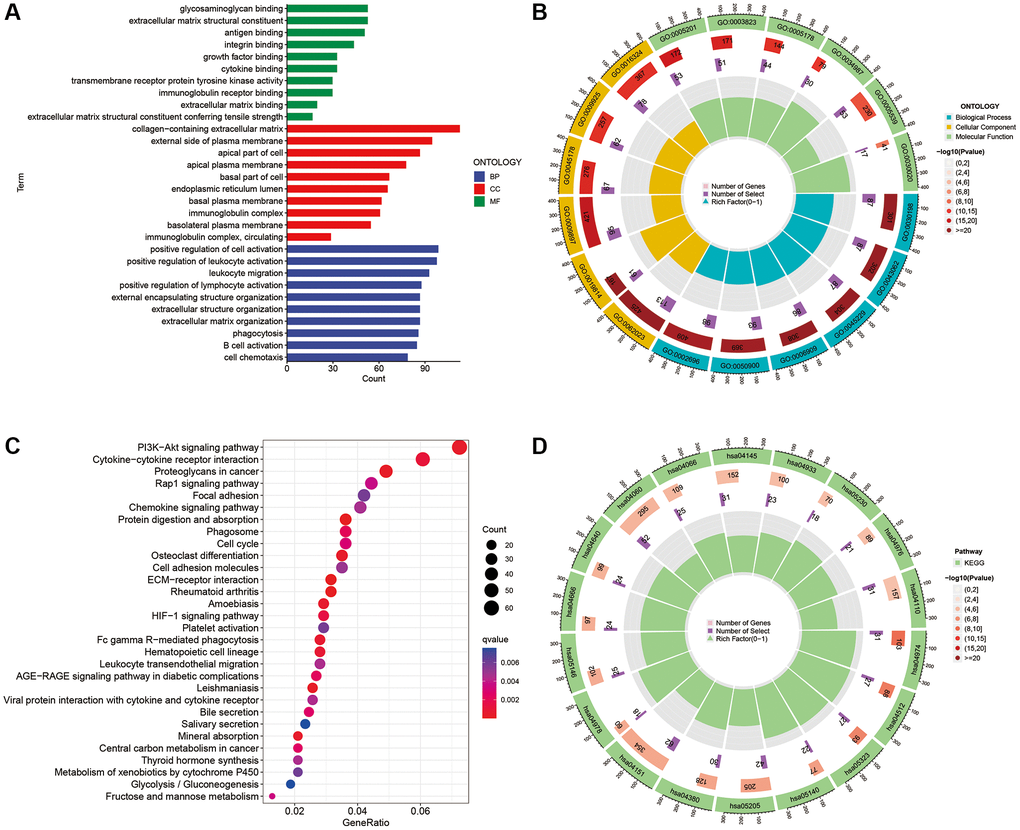
Figure 10.GO and KEGG enrichment analysis. (A, B) GO analysis of DEGs between the two risk subgroups. (C, D) KEGG analysis of the DEGs between the two risk subgroups.
Figure 10 — Identification and validation of a cancer-associated fibroblasts-related scoring system to predict prognosis and immune landscape in hepatocellular carcinoma through integrated analysis of single-cell and bulk RNA-sequencing | Aging