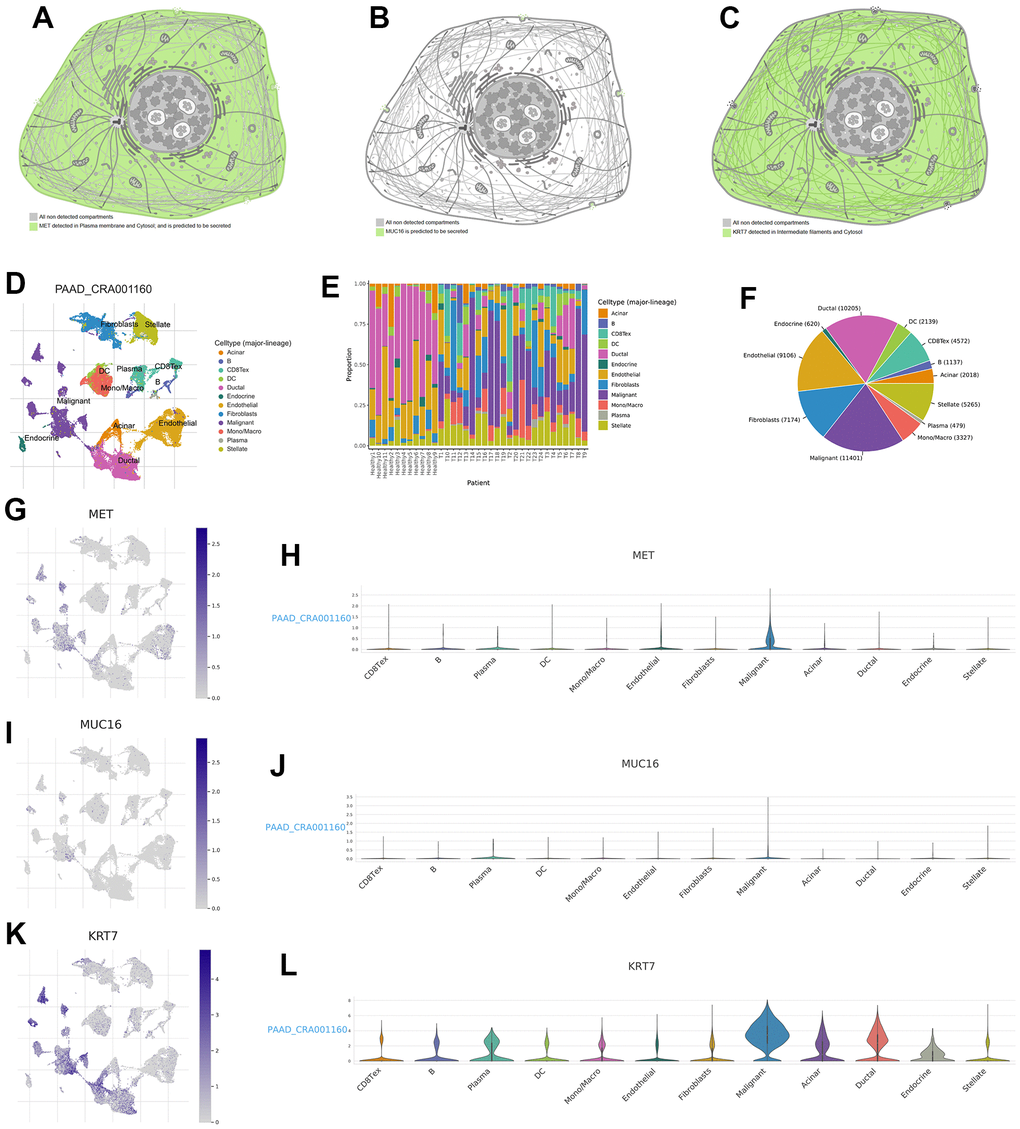
Figure 10.Expression distribution of MET, MUC16, and KRT7 and single-cell analysis. The expression distribution of MET (A), MUC16 (B), and KRT7 (C) in different cell substructures. (D) Annotation of each cell subset. (E) The proportion of each cell subset in each sample. (F) The percentages of each cell in pancreatic tumour microenvironment. (G, H) The distribution and proportion of MET expression within each cell subset. (I, J) The distribution and proportion of MUC16 expression in each cell subset. (K, L) The distribution and proportion of KRT7 expression in each cell subset.