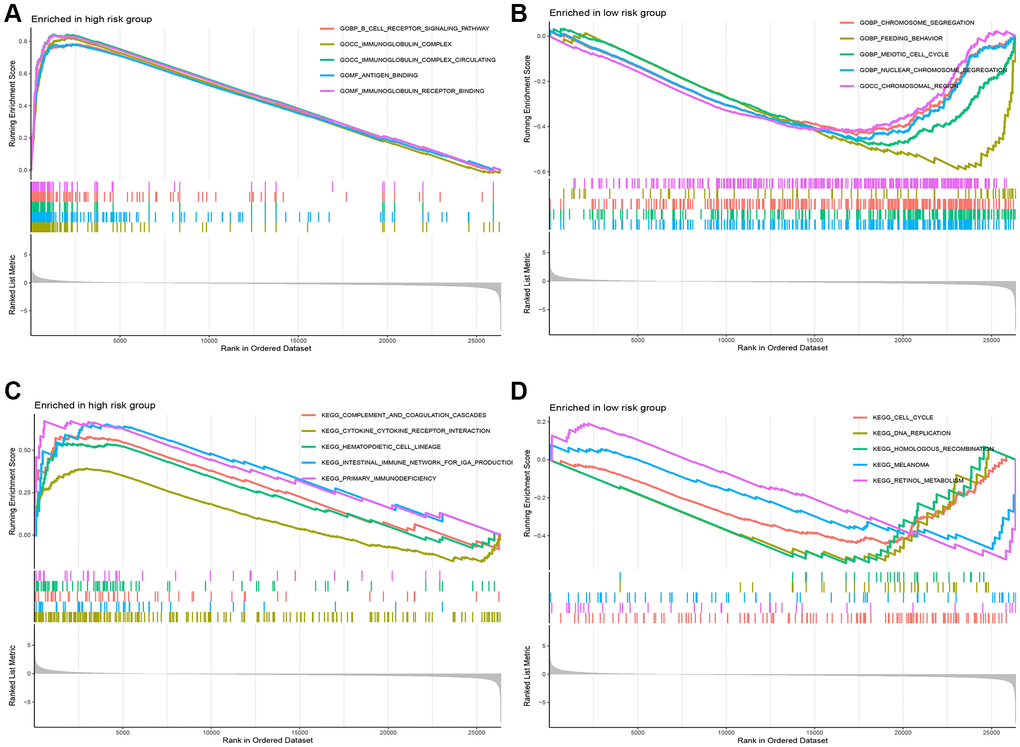
Figure 6.Functional analysis between the high-risk and low-risk groups. (A, B) The pathways of GO enriched in the low- and high-risk group. (C, D) The pathways of KEEG enriched in the low- and high-risk group.
Figure 6 — Prognostic value and immune landscapes of cuproptosis-related lncRNAs in esophageal squamous cell carcinoma | Aging