Submit an Article
Navigate
Home
Editorial Board
Editorial Policies
Current Volume
Archive
Scientific Integrity
Publication Ethics Statements
Interviews with Outstanding Authors
Newsroom
Sponsored Conferences
Podcast
Contact
Special Collections
Submit an Article
Online ISSN: 1945-4589
Research Paper
|
Volume 15, Issue 19
|
pp. 10473–10500
Prognostic value and immune landscapes of cuproptosis-related lncRNAs in esophageal squamous cell carcinoma
Back to article
Figure 10
(10 of 10)
−
100%
+
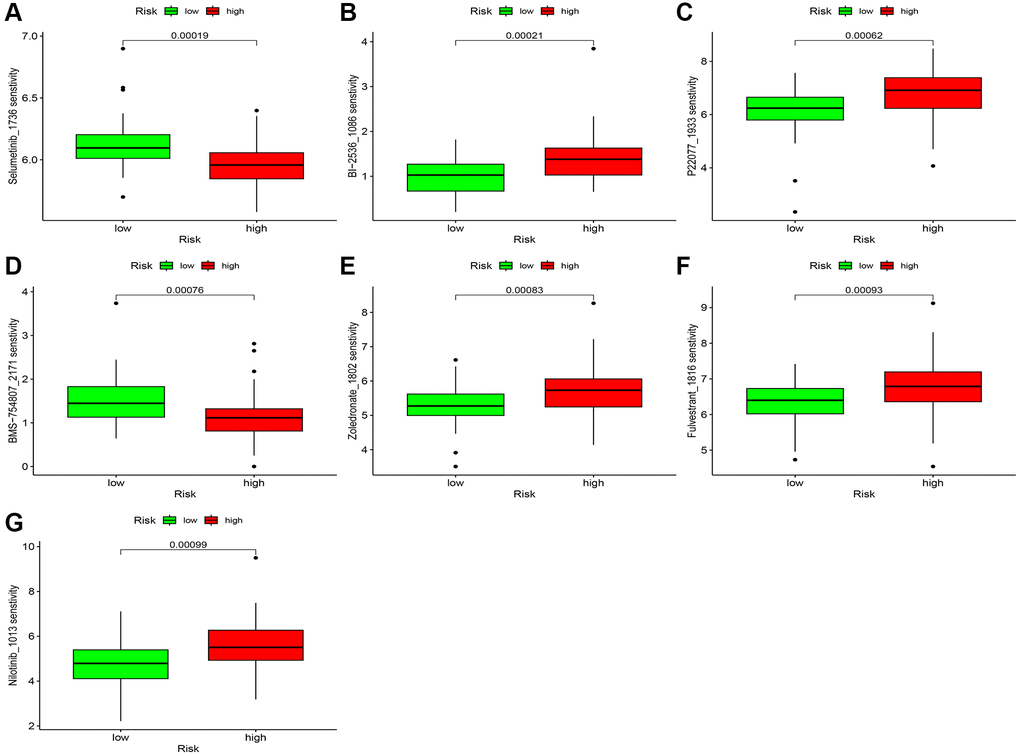
Figure 10.
Chemotherapy sensitivity.
(
A
–
G
) Chemosensitivity difference between two risk groups.
Figure 10 — Prognostic value and immune landscapes of cuproptosis-related lncRNAs in esophageal squamous cell carcinoma | Aging