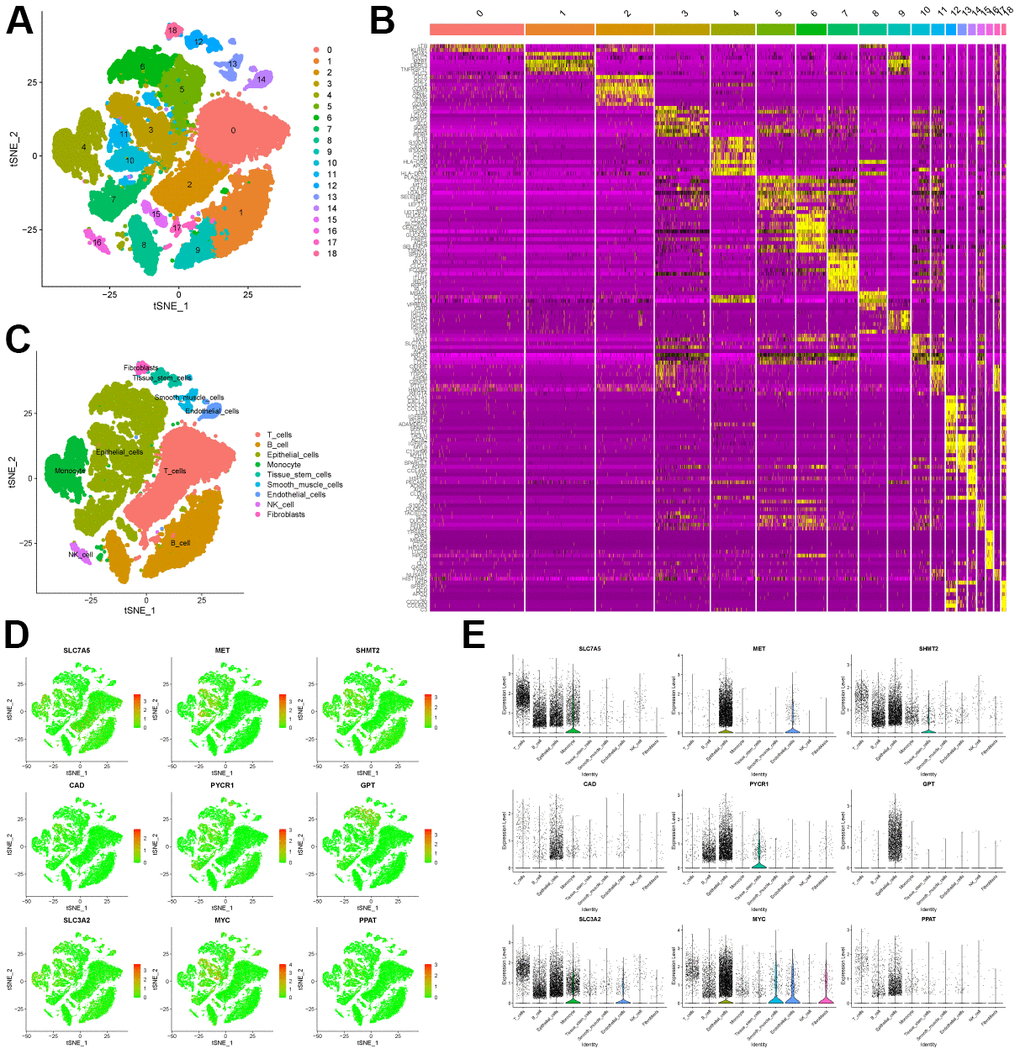
Figure 2.scRNA-seq analysis of CRC tissue. (A) tSNE analysis of CRC tissue scRNA-seq data to classify cell clusters. (B) Heatmap showing the top 10 genes highly expressed in each cell cluster. (C) The “Sin-gleR” package annotates the cell clusters into 9 cell types. (D) The distribution of the characteristic genes in the 9 cell types. (E) The bubble plot shows the expression levels of the characteristic genes in the 9 cell types.