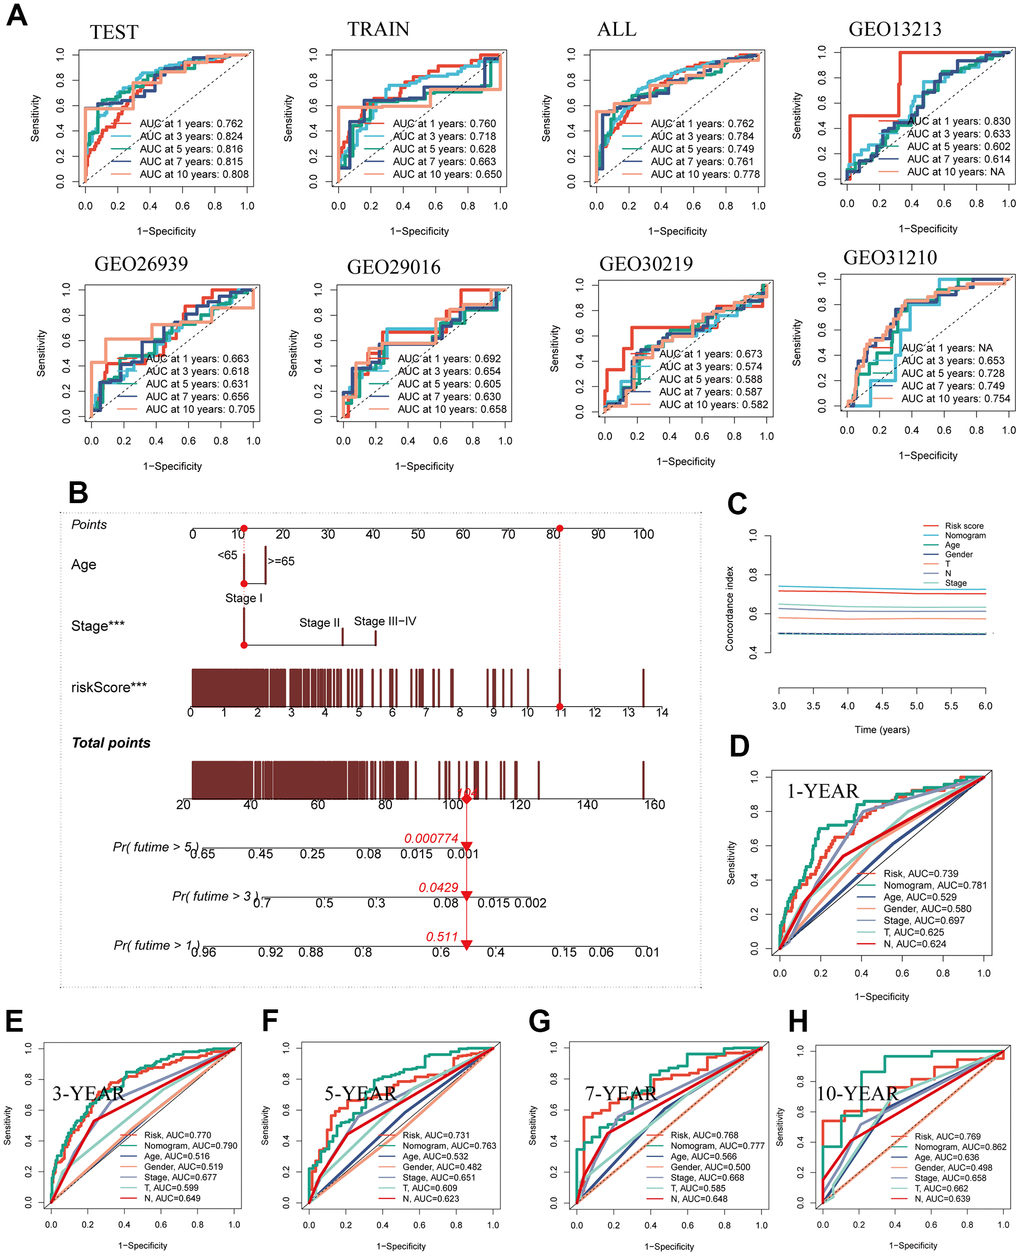
Figure 5.Building a more accurate nomogram. (A) The ROC curve was used to evaluate the performance of the model in the TCGA and five GEO datasets. (B) Nomogram was constructed by combining clinical features with risk groups. (C) C-index curves were utilized to evaluate the predictive performance of different clinical characteristics, nomogram scores, and risk scores. (D–H) ROC curves for 1, 3, 5, 7, and 10 years showed AUC values for various clinical factors, risk scores, and nomogram scores.