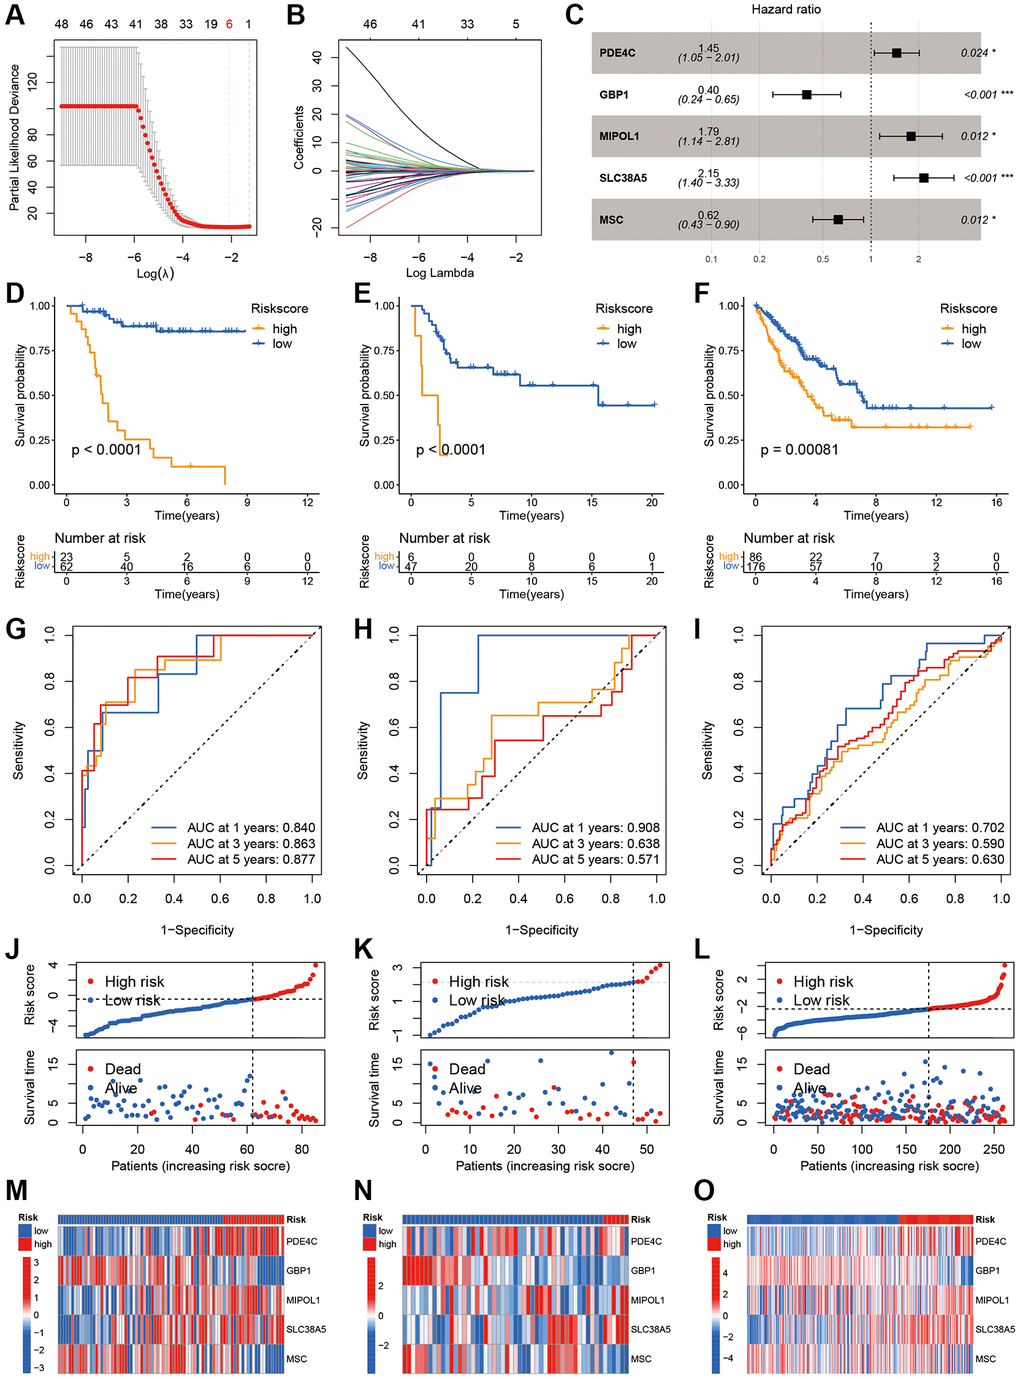
Figure 4.Development and validation of the IEGs score. (A, B) Lasso regression analysis of 79 prognostic DEGs. (C) Multivariate Cox regression analysis. (D–F) Kaplan-Meier curves in the TARGET, GSE21257 and TCGA-SARC cohorts. (G–I) The AUC for the prediction of 1, 3, 5 years survival rate. (J–L) Distribution of survival status and risk scores. (M–O) Heatmap of the five model genes between the high- and low-risk groups.